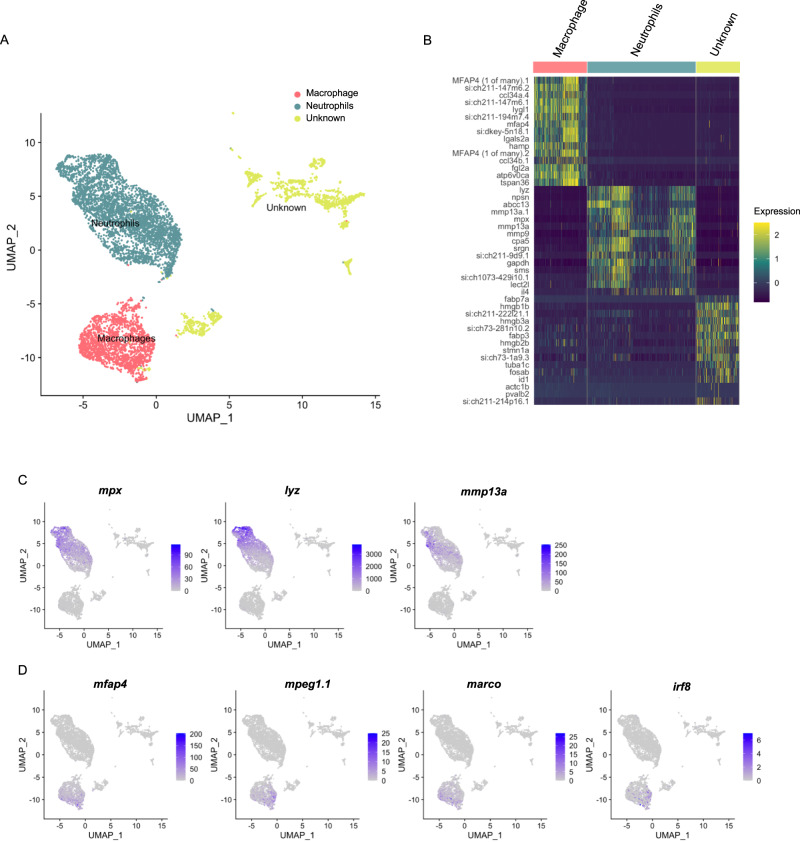
Fig. 4. Single-cell transcriptomic reveal neutrophil and macrophage cell populations.
A UMAP plot displaying the 3 main cell type clusters: neutrophils (3732 cells), macrophages (1830 cells), and an unknown cell type (1466 cells). B Heatmap of top 15 marker genes per cluster (complete list available in Supplementary Data 1, filtered on a minimum detection fraction threshold = 0.1, log fold-change threshold = 0.25 and p-value < 0.05 (not adjusted), negative binomial test, out of the 2000 most variable genes, only genes with positive fold change were selected). C Expression plots of selected markers for neutrophils: mpx, liz, mmp13a and coro1a. D Expression plots of selected markers for macrophages: mfap4, mpeg1.1, marco, irf8.

