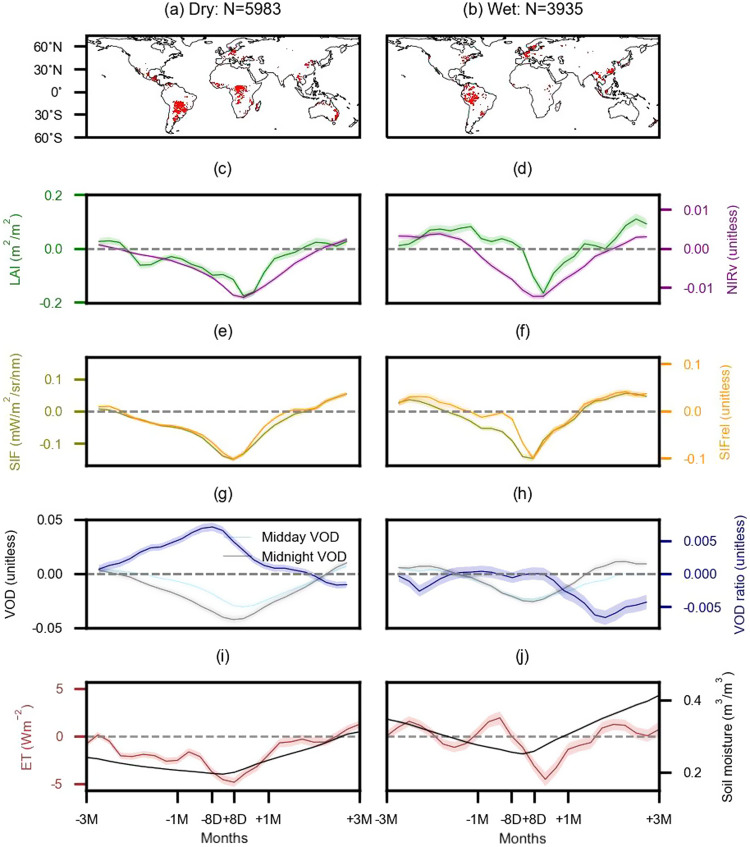
Fig. 2. Drought-related trajectories of multiple remote-sensing vegetation anomalies.
Drought-affected grid cells in (a) dry regions (aridity > 1) and (b) wet regions (aridity <= 1). Results for dry regions are presented in (c, e, g, i) and for wet regions are presented in (d, f, h, j). c, d LAI and NIRv, e, f SIF and relative SIF (SIFrel), g, h VOD at midday, midnight, and the ratio between them (VOD ratio), i, j ET and soil moisture. All vegetation variables are shown as anomalies, except for soil moisture in (i, j) which is presented in absolute values to indicate the actual water amount. Grid cells are only considered if data are available for at least 20 out of the 24 displayed time steps before, during, and after drought peaks. The solid lines denote mean values across grid cells. Shades in figures denote the mean standard error which is computed based on the standard deviation across the anomalies of every third grid cell in latitudinal and longitudinal directions, respectively. Using a subset of grid cells as opposed to all wet or dry grid cells, the effect of spatial autocorrelation is reduced.

