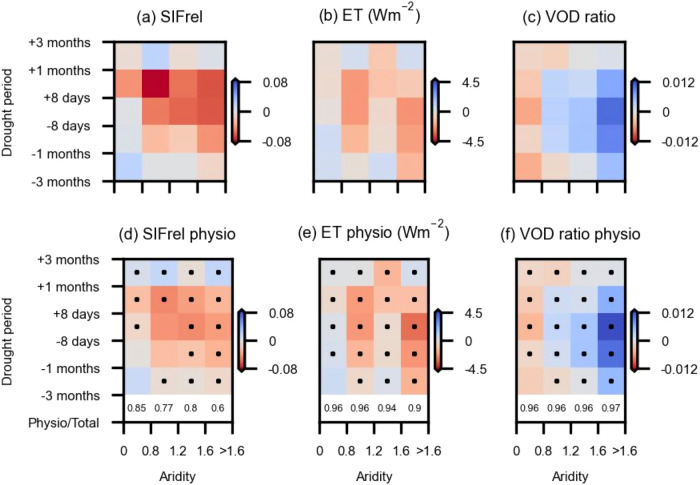
Fig. 3. Vegetation functional and physiological responses to drought.
Ecosystem functioning during drought as reflected by a SIFrel (unitless), b ET (Wm-2), and c VOD ratio (unitless) anomalies. Ecosystem physiology (physio) is estimated as the components of d SIFrel, e ET, and f VOD ratio anomalies remaining after removing the LAI-related variations. Each aridity-drought period box shows the median value across corresponding grid cells and time windows. Aridity classes are chosen to yield a similar number of grid cells in each group on the x-axis. The numbers in the bottom rows denote the median ratio between vegetation physiological anomalies and total functional anomalies across the entire drought period (Physio/Total). Black dots in each bin denote that in more than 60% of the grid cells, the vegetation physiological anomaly is significantly different (95 % confidence) from a random sample of 1000 members from the same season (i.e. ± 16-day time steps) of a non-drought year.

