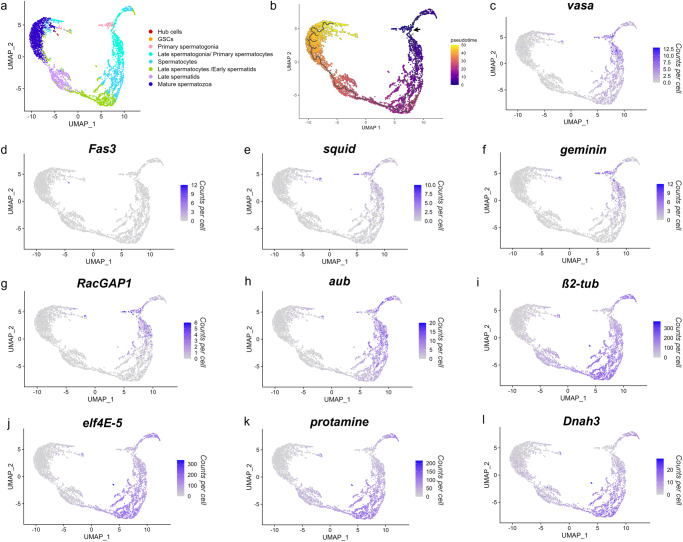
Fig. 2. Pseudotime trajectory of single cells and expression profiles of annotated germline marker genes.
a UMAP (Uniform Manifold Approximation and Projection) non-linear dimension reduction is used to plot single cells (single dots) in relation to each other in 2D space. b Pseudotime trajectory plot showing predicted differentiation of germline cells (black line). The root node at which pseudotime is zero (indigo) was selected using known expression of the vasa gene (AGAP008578) in the premeiotic germline cells (black arrow). Pseudotime values are automatically assigned to remaining cells with higher values (yellow) representing a further differentiation from cells near the root node. c–l Linear expression levels of marker genes (counts per cell) for vasa (AGAP008578), Fas3 (AGAP029564), squid (AGAP000399), geminin (AGAP000496), RacGAP1 (AGAP008912), aubergine (AGAP011204), ß2-tubulin (AGAP008622), elf4E-5 (AGAP007172), protamine (AGAP028569) and Dnah3 (AGAP007675) are displayed on a graded colour scale.

