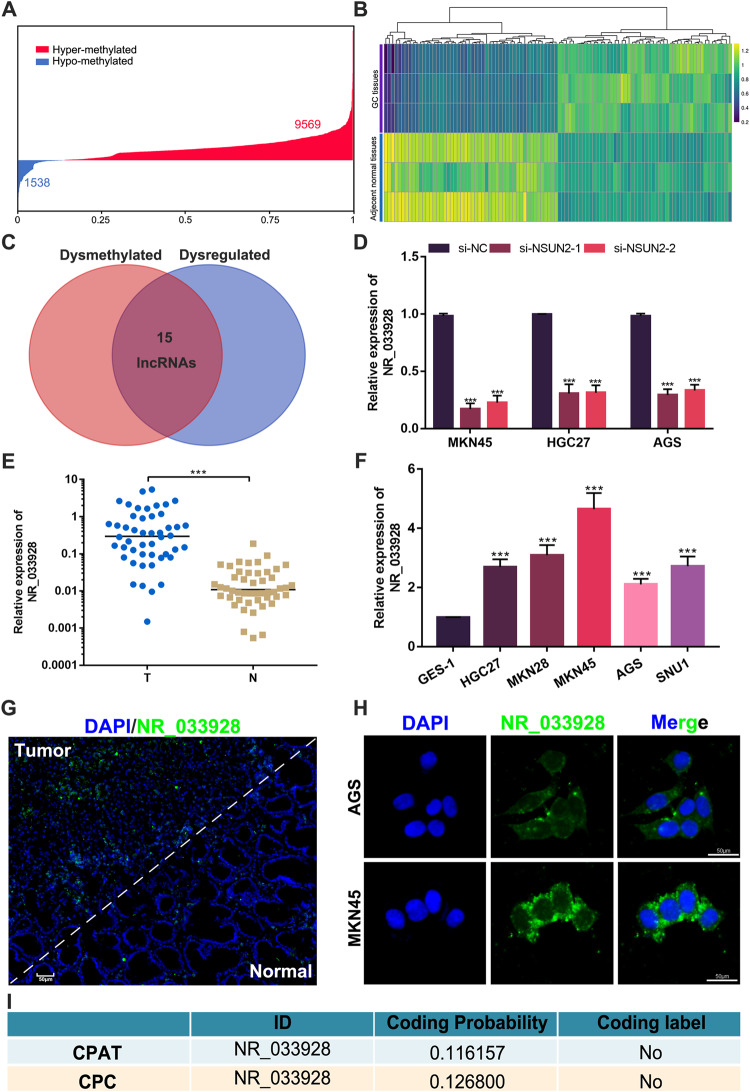
Fig. 2. Identification and characterization of NR_033928.
A Distribution of the different methylation levels of lncRNAs in GC tumors. B A heatmap showing the lncRNAs differentially expressed in three pairs of gastric cancer and adjacent normal tissues. C A Venn diagram showing the intersected dysmethylated and dysregulated lncRNAs in GC. D Relative expression of NR_033928 in GC cells transfected with NSUN2 siRNAs. E Relative expression of NR_033928 in 48 pairs of tumors and adjacent normal tissues. F Relative expression of NR_033928 in GES-1 and GC cell lines. G Representative FlSH image of NR_033928 in GC tissues. Scale bar = 50 μm. H Representative FlSH image of of NR_033928 in GC cells. Scale bar = 50 μm. I Predicated coding potential of NR_033928 in CPAT and CPC. (Graph represents mean ± SD; ***p < 0.001).

