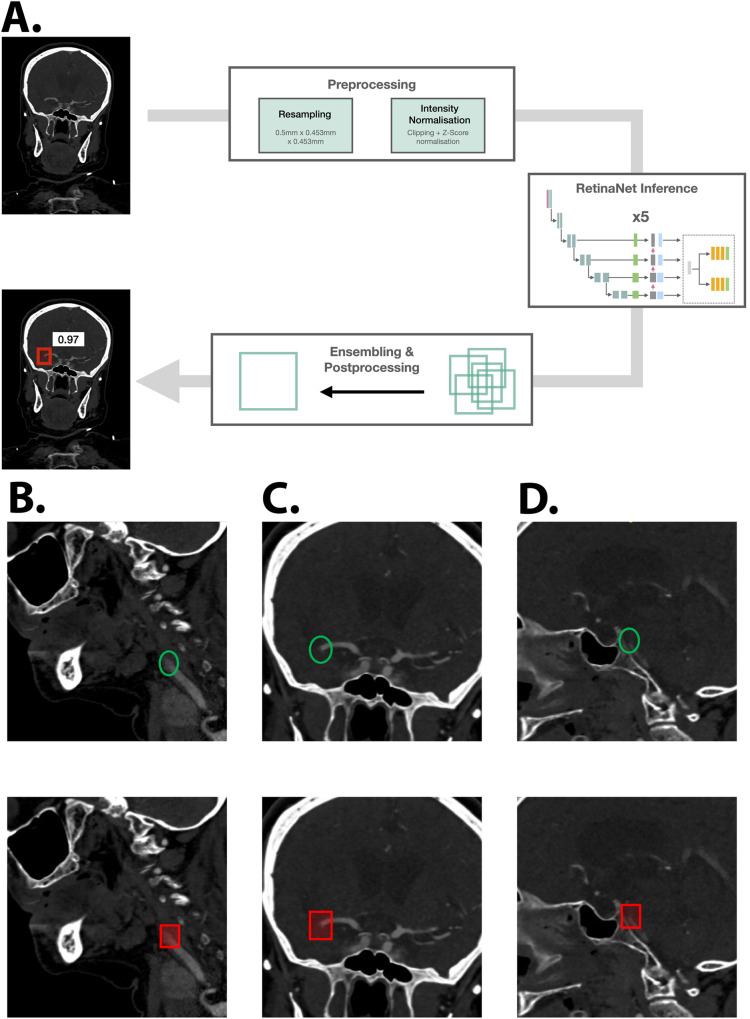
Fig. 2. Flowchart of the inference pipeline and example results.
The flowchart presenting the inference pipeline of our method is shown in (A): data were first pre-processed by resampling the data to the target spacing and normalizing the voxel intensities, and the predictions from the models from fivefold cross-validation are then emsembled into the final label (combination via Weighted Box Cluster). The prediction of the artificial neural network (ANN) is visualized as a red bounding box and the associated confidence score is written next to it. In the lower box, (B), (C) and (D) show representative output samples. The top row shows the underlying ground truth annotation for evaluation as a green circle. The bottom row shows the predicted bounding box by the artificial neural network (ANN) as a red square. B Left proximal internal carotid occlusion (sagittal view). C Left M1 middle cerebral artery occlusion (coronal view) (D) Basilar occlusion (sagittal view). Images are depicted using the radiological standard orientation (left image side corresponds to the patient’s right side).

