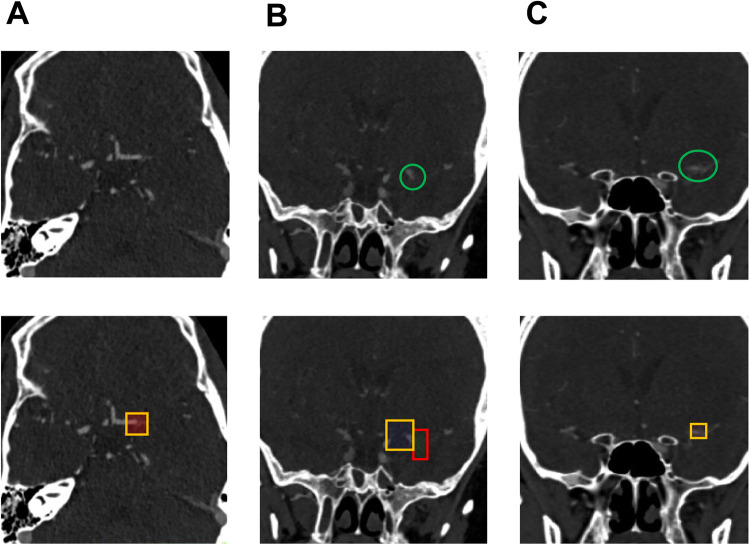
Fig. 4. False positive output samples.
The top row row shows the underlying ground truth annotation for evaluation as a green circle, if applicable. The bottom row shows the predicted bounding box by the artificial neural network (ANN) as a yellow square for predictions classified as false positive and red square for predictions classified as true positive. A False positive prediction at the left carotid T in a patient with proximal internal carotid artery occlusion. The retrograde perfusion of the left A1-anterior cerebral artery is responsible for this impression. (axial view). B False positive prediction of a subtotal left M1-middle cerebral artery occlusion, followed by a correctly predicted total left M1 occlusion. (coronal view). C M1-middle cerebral artery occlusion classified as false positive. The prediction is correctly located, but the volume of the predicted bounding box is too low compared to the annotation and hence does not reach the intersection-over-union (IoU)-threshold to be classified as true positive. (coronal view). Images are depicted using the radiological standard orientation (left image side corresponds to the patient’s right side).

