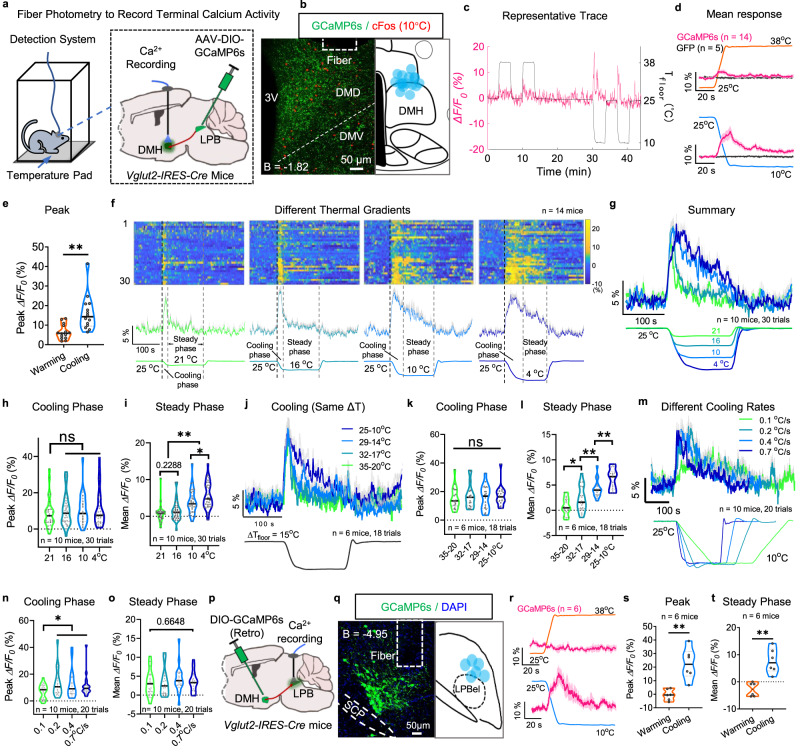
Fig. 2. Neural dynamics of LPB → DMH projection in response to thermal stimuli.
a Fiber photometry to record the calcium dynamics of LPBVglut2 neural terminals in the DMH with GCaMP6s. b Representative expression of GCaMP6s from LPBVglut2 neural terminals (left) and summary of fiber tracts (shown as blue dots, right) in the DMH with cold-induced cFos immunoactivity. This experiment was repeated at least 14 times independently with similar results. c A representative trace showing calcium dynamics of LPBVglut2 neural terminals in the DMH in response to warm and cold stimuli. d, e Calcium dynamics after warming or cooling the floor. (GCaMP6s, n = 14 mice; GFP, n = 5 mice). f–i Calcium dynamics (f, g) and quantification (h, i) of LPBVglut2 neural terminals in the DMH in response to different cool/cold floor temperatures. j–l Calcium dynamics (j) and quantification (k, l) of LPBVglut2 neural terminals in the DMH in response to cooling from different starting temperatures but the same temperature reduction. (n = 6 mice, 3–5 trials per mouse). m–o Calcium dynamics (m) and quantification (n, o) of LPBVglut2 neural terminals in the DMH in response to different cooling rates. (n = 10 mice, 2 trials per mouse). p, q Recording from DMH-projecting LPBVglut2 neurons (p) and representative expression of GCaMP6s (left) and summary of fiber tracts (shown as blue dots, right) (q). This experiment was repeated at least 6 times independently with similar results. r Calcium dynamics of DMH-projecting LPBVglut2 neurons in response to floor warming or cooling (n = 6 mice). s, t Peak ΔF/F0 values (s) during floor warming or cooling and Mean ΔF/F0 values (t) during the steady phase after floor warming or cooling (n = 6 mice). All data are the mean ± sem (except c), and (h, i, k, l, n, o) were analyzed by one-way RM ANOVA followed by Bonferroni’s multiple comparisons test, (e, s, t) were analyzed by unpaired t-test. P-values are calculated based on statistical tests in Supplementary Table 2. *p ≤ 0.05; **p ≤ 0.01; ns, not significant. Source data are provided as a Source data file.

