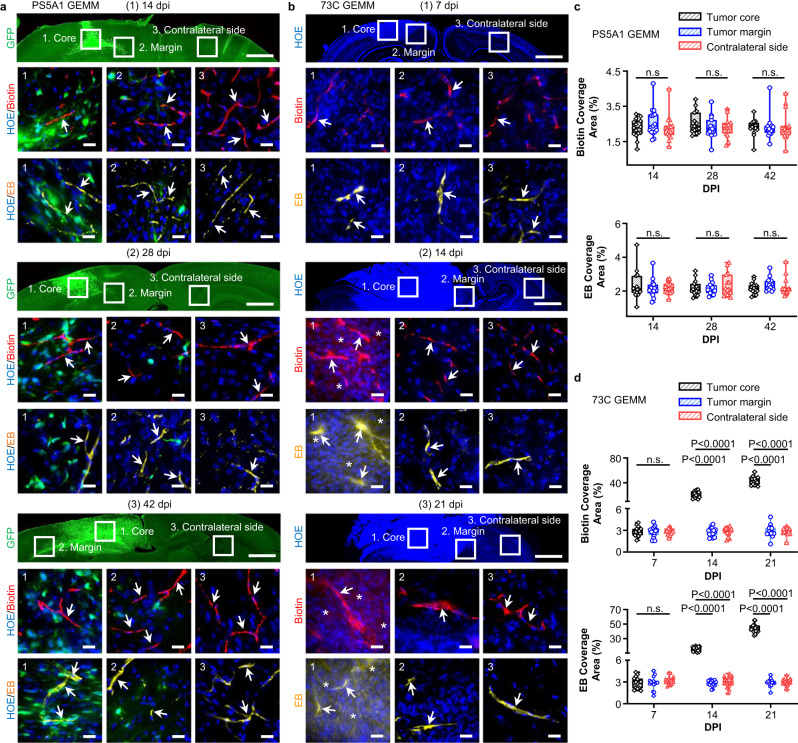
Fig. 1. PS5A1 GEMM has an intact BBTB, and 73 C GEMM shows heterogeneous loss of BBTB integrity during disease progression.
a Characterization of the BBTB permeability in PS5A1 GEMM using EZ-link biotin (Biotin, red, 660 Da) and Evans blue (EB, yellow, 66 kDa when bound to albumin) at 14-, 28-, and 42-days post injection (dpi). The tumor cells express GFP, and the cell nuclei are indicated by Hoechst staining (HOE, blue). The ROIs selected are (1) tumor core, (2) tumor margin, and (3) contralateral side with no tumor. The scale bars represent 1 mm in the top panel and 20 µm in the bottom panels. The blood vessels are indicated by arrows. b Characterization of the BBTB permeability in 73 C BBTB using EZ-link biotin (Biotin, red) and Evans blue (EB, yellow) at 7–21 dpi. The cell nuclei are indicated by Hoechst staining (HOE, blue). The ROIs selected are (1) tumor core, (2) tumor margin, and (3) contralateral side with no tumor. The blood vessels are indicated by arrows, and the dye leakage is indicated by asterisks. The scale bars represent 1 mm in the top panel and 20 µm in the middle and bottom panels. c, d The quantification of biotin and Evans blue coverage in PS5A1 and 73 C GEMMs by area fraction. Data are expressed as Mean ± SD. N = 15 images from 3 mice. Data in the box and whisker plots are given from the minima to maxima, the bounds of the box represent the 25th percentile and 75th percentile, and the middle line of the box is the median. Data were analyzed by One-way ANOVA followed by Tukey’s multiple comparisons test. n.s. represents no significant difference. Source data are available as a Source Data file.

