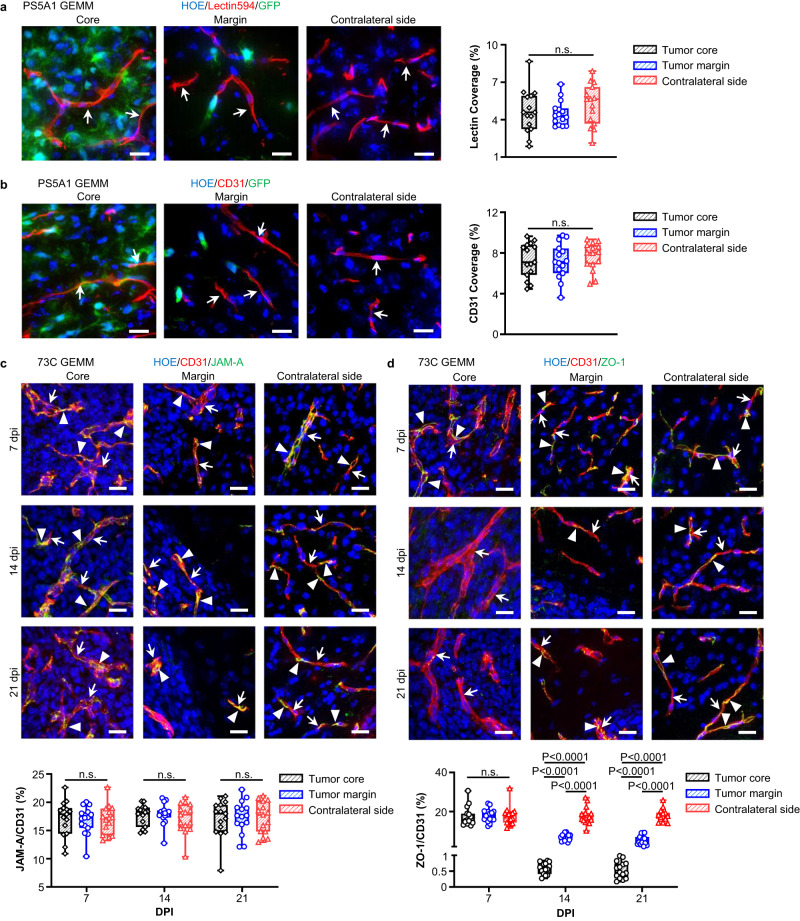
Fig. 2. PS5A1 GEMM shows diffuse infiltration and vascular co-option for tumor cells while 73 C GEMM shows vascular angiogenesis with loss of ZO-1 coverage.
a Blood vessel labeling with tomato lectin594 (indicated by arrows) in PS5A1 GEMM at 14 days post injection (dpi) and the quantification of lectin coverage by area fraction. The scale bars represent 20 µm. N = 15 images from 3 mice. b Blood vessel labeling with CD31 (indicated by arrows) in PS5A1 GEMM at 14 dpi and the quantification of CD31 coverage by area fraction. The scale bars represent 20 µm. N = 15 images from 3 mice. c, d IHC staining and quantification of junctional protein JAM-A and ZO-1 in 73 C GEMM at 7–21 dpi. The blood vessels are stained with CD31 (red), and the cell nuclei are indicated by Hoechst staining (HOE, blue). The arrows indicate blood vessels, and the arrowheads indicate tight junction proteins. The scale bars represent 20 µm. The quantification of JAM-A and ZO-1 coverage on the blood vessel by area fraction. N = 15 images from 3 mice. In a–d, data in the box and whisker plots are given from the minima to maxima, the bounds of the box represent the 25th percentile and 75th percentile, and the middle line of the box is the median. Data were analyzed by One-way ANOVA followed by Tukey’s multiple comparisons test, n.s. represents no significant difference. Source data are available as a Source Data file.

