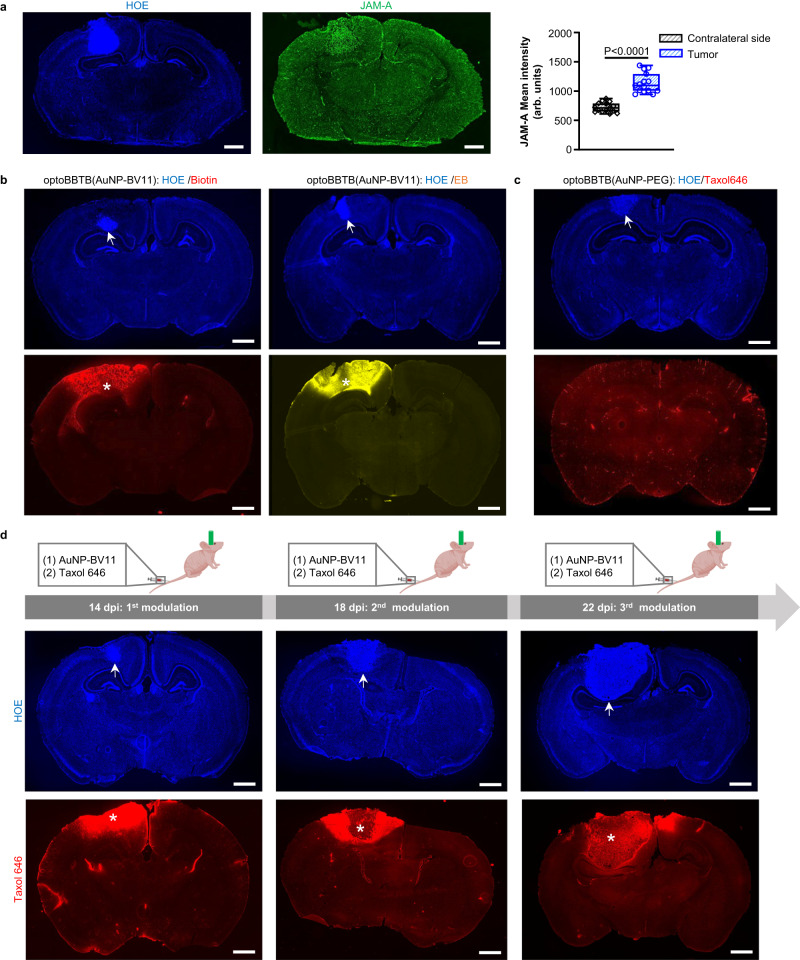
Fig. 4. OptoBBTB improves drug penetration to the brain in the angiogenic 73 C GEMM.
a IHC staining shows overexpression of JAM-A in the 73 C GEMM at 7 days post injection (dpi). The cell nuclei are indicated by Hoechst staining (HOE). The scale bars represent 1 mm. The quantification of JAM-A expression in the normal brain (contralateral side) and the tumor was performed by analyzing mean fluorescent intensity. N = 15 region of interests (ROIs) from 3 mice. Data in the box and whisker plots are given from the minima to maxima, the bounds of the box represent the 25th percentile and 75th percentile, and the middle line of the box is the median. Data were analyzed by unpaired Student’s two-sided t-test. b optoBBTB with ps laser and AuNP-BV11 allows the delivery of small molecule EZ-link biotin (660 Da) and large molecule Evans blue (66 kDa, albumin-bound) to the tumor. The tumor is indicated by Hoechst staining of the cell nuclei (HOE, arrow). The scale bars represent 1 mm. c OptoBBTB using ps laser and AuNP-PEG does not improve the delivery of fluorescent Taxol (Taxol646). The tumor is indicated by Hoechst staining of the cell nuclei (HOE, arrow). The scale bar represents 1 mm. d Multiple BBTB modulations in the 73 C GEMM at 4, 8, and 12 dpi. AuNP-BV11 and Taxol646 were injected intravenously. The cell nuclei are indicated by Hoechst staining (HOE, arrow), and Taxol646 leakage is indicated by asterisks. The scale bars represent 1 mm. In b–d, three independent experiments were performed and similar results are provided in the Source Data file. Source data are available as a Source Data file.

