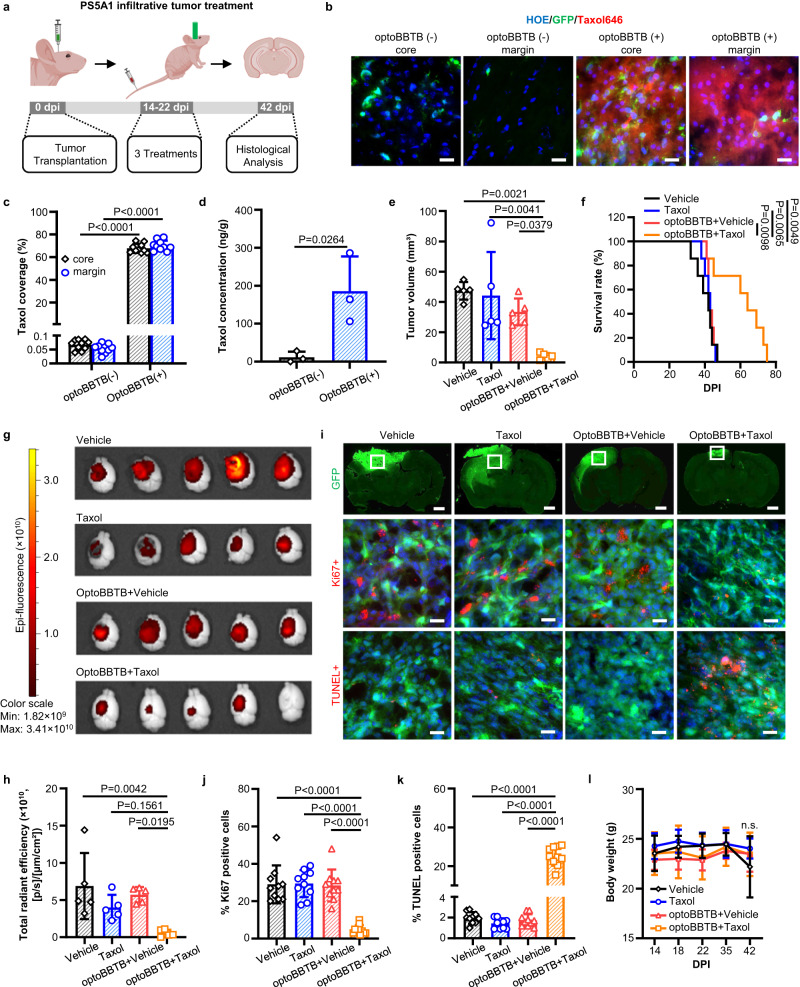
Fig. 5. OptoBBTB improves therapeutic outcomes in the infiltrative PS5A1 GEMM.
a Schematic illustration of the treatment timeline. The illustration figure was created with Biorender.com. b, c OptoBBTB facilitates the delivery of fluorescent Taxol646 to the tumor core and margin. The scale bar represents 20 µm. The quantification of Taxol delivery was performed by analyzing fluorescent area fraction. For each group, N = 10 images from 3 mice. Data are expressed as Mean ± SD. d The analysis of Taxol concentration in the tumor without or with optoBBTB at 14 days post injection (dpi). N = 3 mice. Data are expressed as Mean ± SD. e The analysis of tumor volume by GFP fluorescent signal at 42 dpi. N = 5 mice in each group. Data are expressed as Mean ± SD. f Kaplan-Meier survival analysis. N = 7 mice in each group. g, h Tumor size imaging by GFP fluorescent, and the quantification of GFP fluorescent using Living Image® Software for IVIS® Lumina III In Vivo Imaging System. N = 5 mice in each group. Data are expressed as Mean ± SD. i Top: Tumor area indicated by GFP fluorescent at 42 dpi. The scale bar represents 1 mm. Middle: Ki67 staining shows cell proliferation. Bottom: TUNEL staining indicates cell apoptosis. The scale bars represent 20 µm. The ki67 and TUNEL images were taken from the boxes in the top lane. j, k Quantification of Ki67 staining and TUNEL staining after treatments. N = 10 images from 3 mice. Data are expressed as Mean ± SD. l The record of body weight change during 0-42 dpi in PS5A1 GBM treatment. N = 5 mice in each group. Data are expressed as Mean ± SD. Data in c and d were analyzed by unpaired Student’s two-sided t-test, in e, h, j, k, and l were by One-way ANOVA followed by Tukey’s multiple comparisons test, and in f were by logrank test. Source data are available as a Source Data file.

