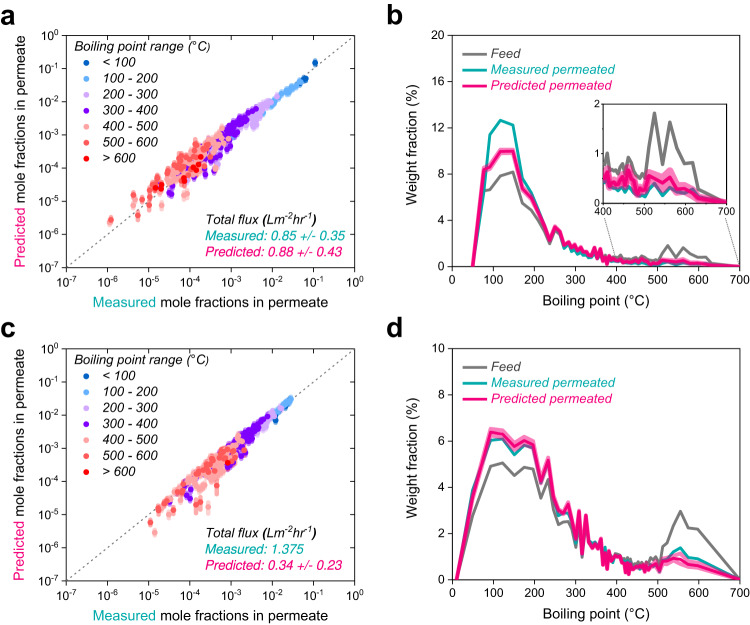
Fig. 4. Predictions of crude oil fractionation compared to experiments.
a, c Parity plots comparing experimental and predicted permeate mole fractions after the fractionation of Permain crude oil by SBAD-1 membrane (a) and Arab Light crude oil by DUCKY-9 membrane (c). Blue-to-red colors are assigned to different boiling point ranges of molecules in the crude oil mixtures. The shaded area around each point represents the standard deviation of the permeate concentration predictions for each molecule. The deviations are from the uncertainty in the machine learning (ML) sorption model parameter predictions. The deviations in the total flux predictions are the uncertainty in the ML diffusion model predictions. b, d Differential weight fraction relative to boiling points of molecules in the Permian crude oil mixture before and after fractionation by SBAD-1 membrane (b) and in the Arab Light crude oil mixture before and after fractionation by DUCKY-9 membrane (d). The curve shows the local slope of the concentration/boiling point over a period of 6 molecules. The lighter shade displays the deviation in the predicted weight fractions of the permeate. Source data are provided in the Source Data file.

