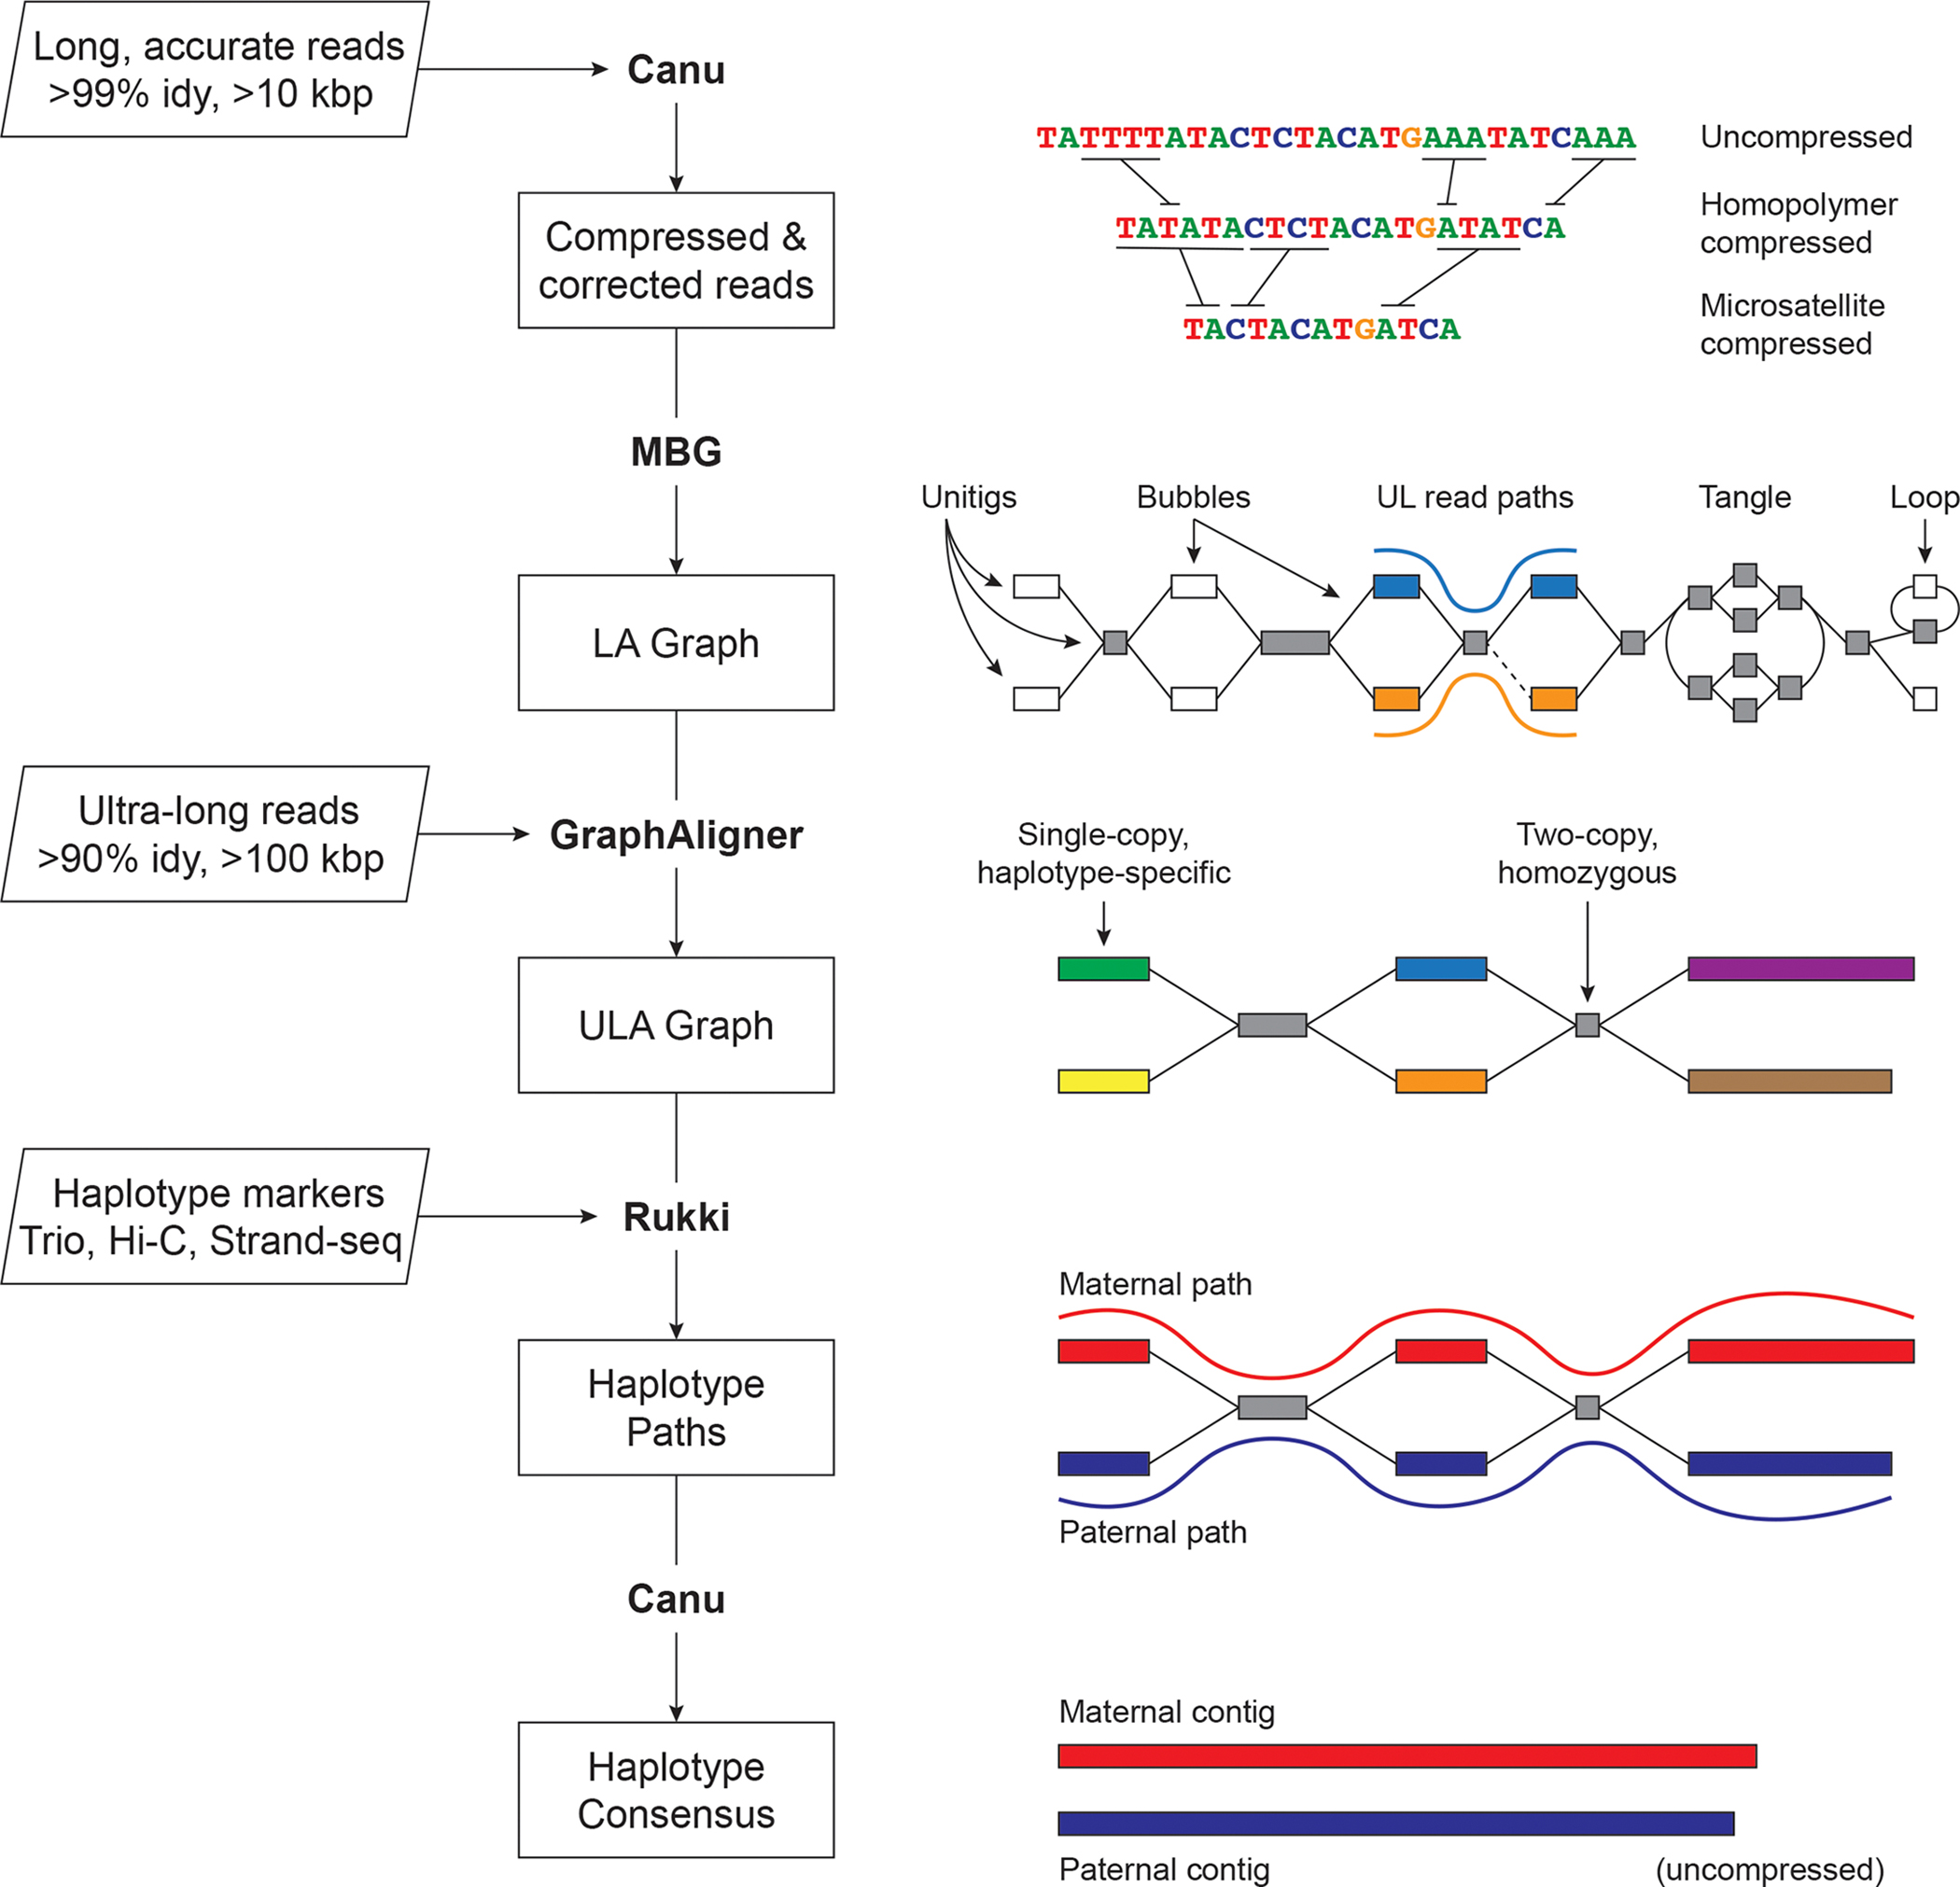
Figure 1. Verkko assembly workflow.

Inputs are on the left, with program outputs listed in rectangles. Key components of the pipeline are highlighted, including Canu 8, MBG 60, GraphAligner 61, and Rukki (Online Methods). Using the outputs of these tools, Verkko performs successive rounds of processing and graph resolution. Input reads are first homopolymer compressed and error corrected, and remain so throughout the process. MBG also compresses microsatellites to aid graph construction, but only internally. The first graph output by Verkko is an accurate, high-resolution de Bruijn graph built from the long, accurate reads (LA Graph). This is a node-labeled graph comprising unitigs (nodes) and their adjacency relationships (edges). Ultra-long reads are then aligned to the LA graph to identify read paths (blue curve, orange curve), and Verkko uses them for phasing bubbles, filling gaps (dotted edge), and resolving loops and tangles. The resulting simplified graph (ULA Graph) is typically composed of single-copy, haplotype specific unitigs, separated by two-copy, homozygous unitigs that could not be phased from the read data alone. Haplotype-specific markers are then used to label nodes in the ULA graph and identify haplotype paths through the graph (maternal, red; paternal, blue). These paths are converted to haplotype-specific contigs using a consensus algorithm that recovers the homopolymers.
