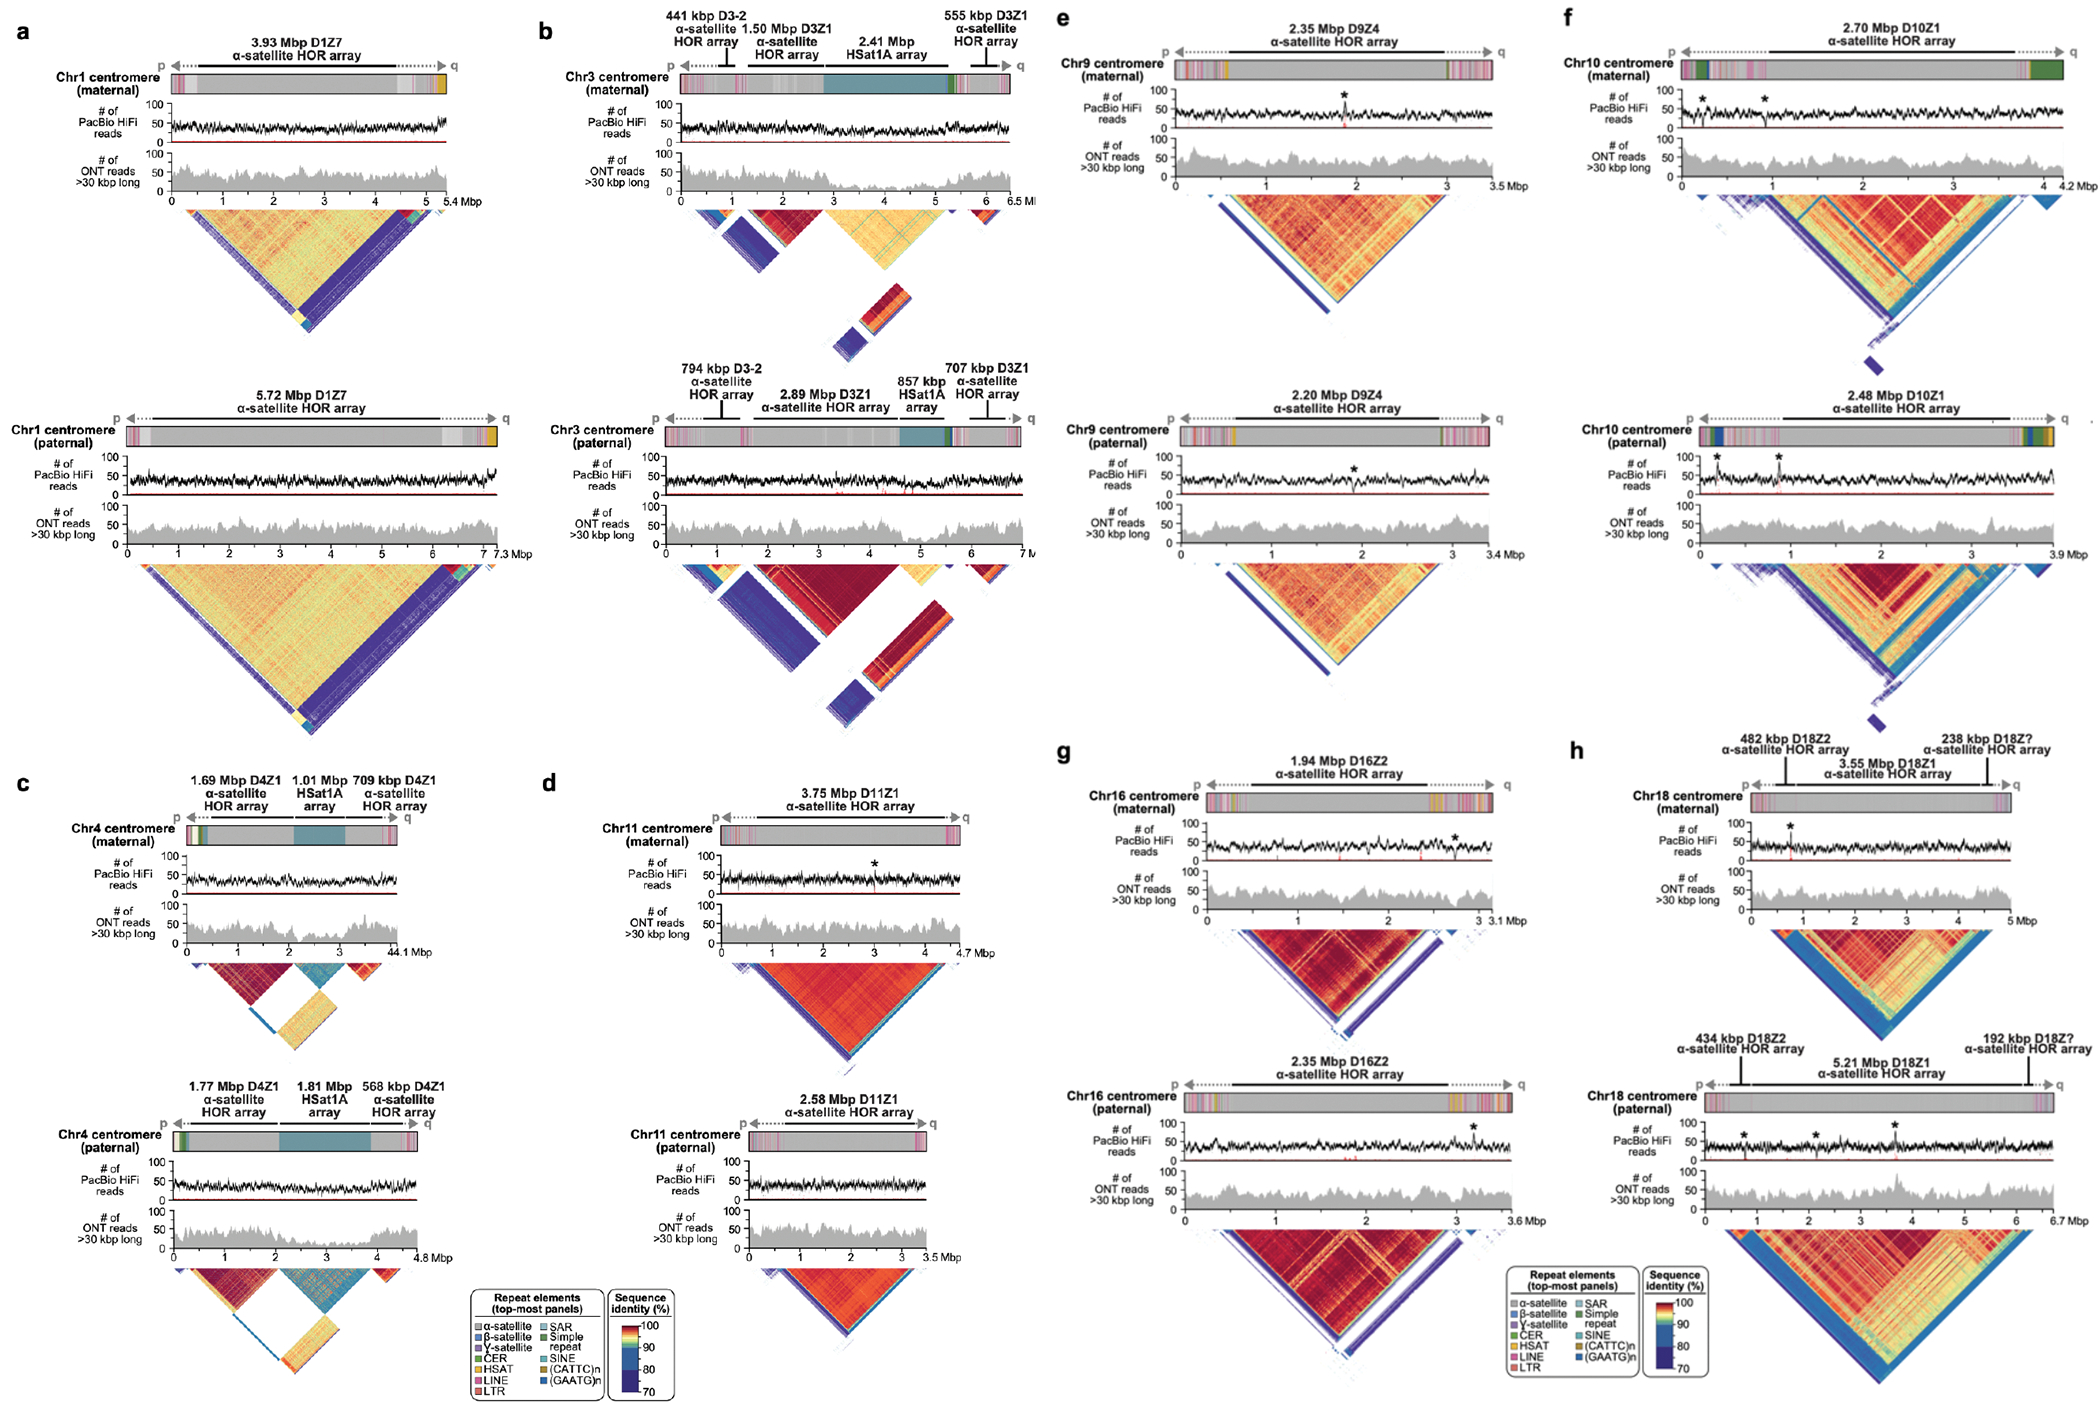
Extended Data Figure 8. Full-coverage Verkko trio assemblies of chromosome 1 (a), 3 (b), 4 (c), 11 (d), 9 (e), 10 (f), 16 (g), and 18 (h) centromeric regions in the HG002 genome.

Both maternal and paternal haplotypes are shown, with repeat element annotation shown on top, followed by PacBio HiFi coverage, ONT coverage, and StainedGlass 63 plots. As with the Chromosome 19 centromeres (Fig. 4), the maternal and paternal haplotypes show large-scale structural variation, with alpha-satellite HOR arrays sizes varying by tens to hundreds of kb. Sites with discrepant HiFi mappings (low coverage or high coverage) are marked with an asterisk. There are few sites in the centromeres, and the artifacts are localized and often inconsistent between ONT and HiFi alignments, indicating the assembly is overall of high quality. To further validate assembly accuracy, we intersected centromere array locations with VerityMap errors and found that in all but four cases (two on the Chr1 paternal centromere, Chr9 paternal centromere, and Chr10 maternal centromere), the errors were short (≤1 kb) or lower frequency (≤50% of the reads). VerityMap also identified one issue, with ≥50% of reads deviating in the Chr4 maternal centromere. However, this was not visible in the NucFreq 37,83 plots above, and the region only had a total of three mapped reads.
