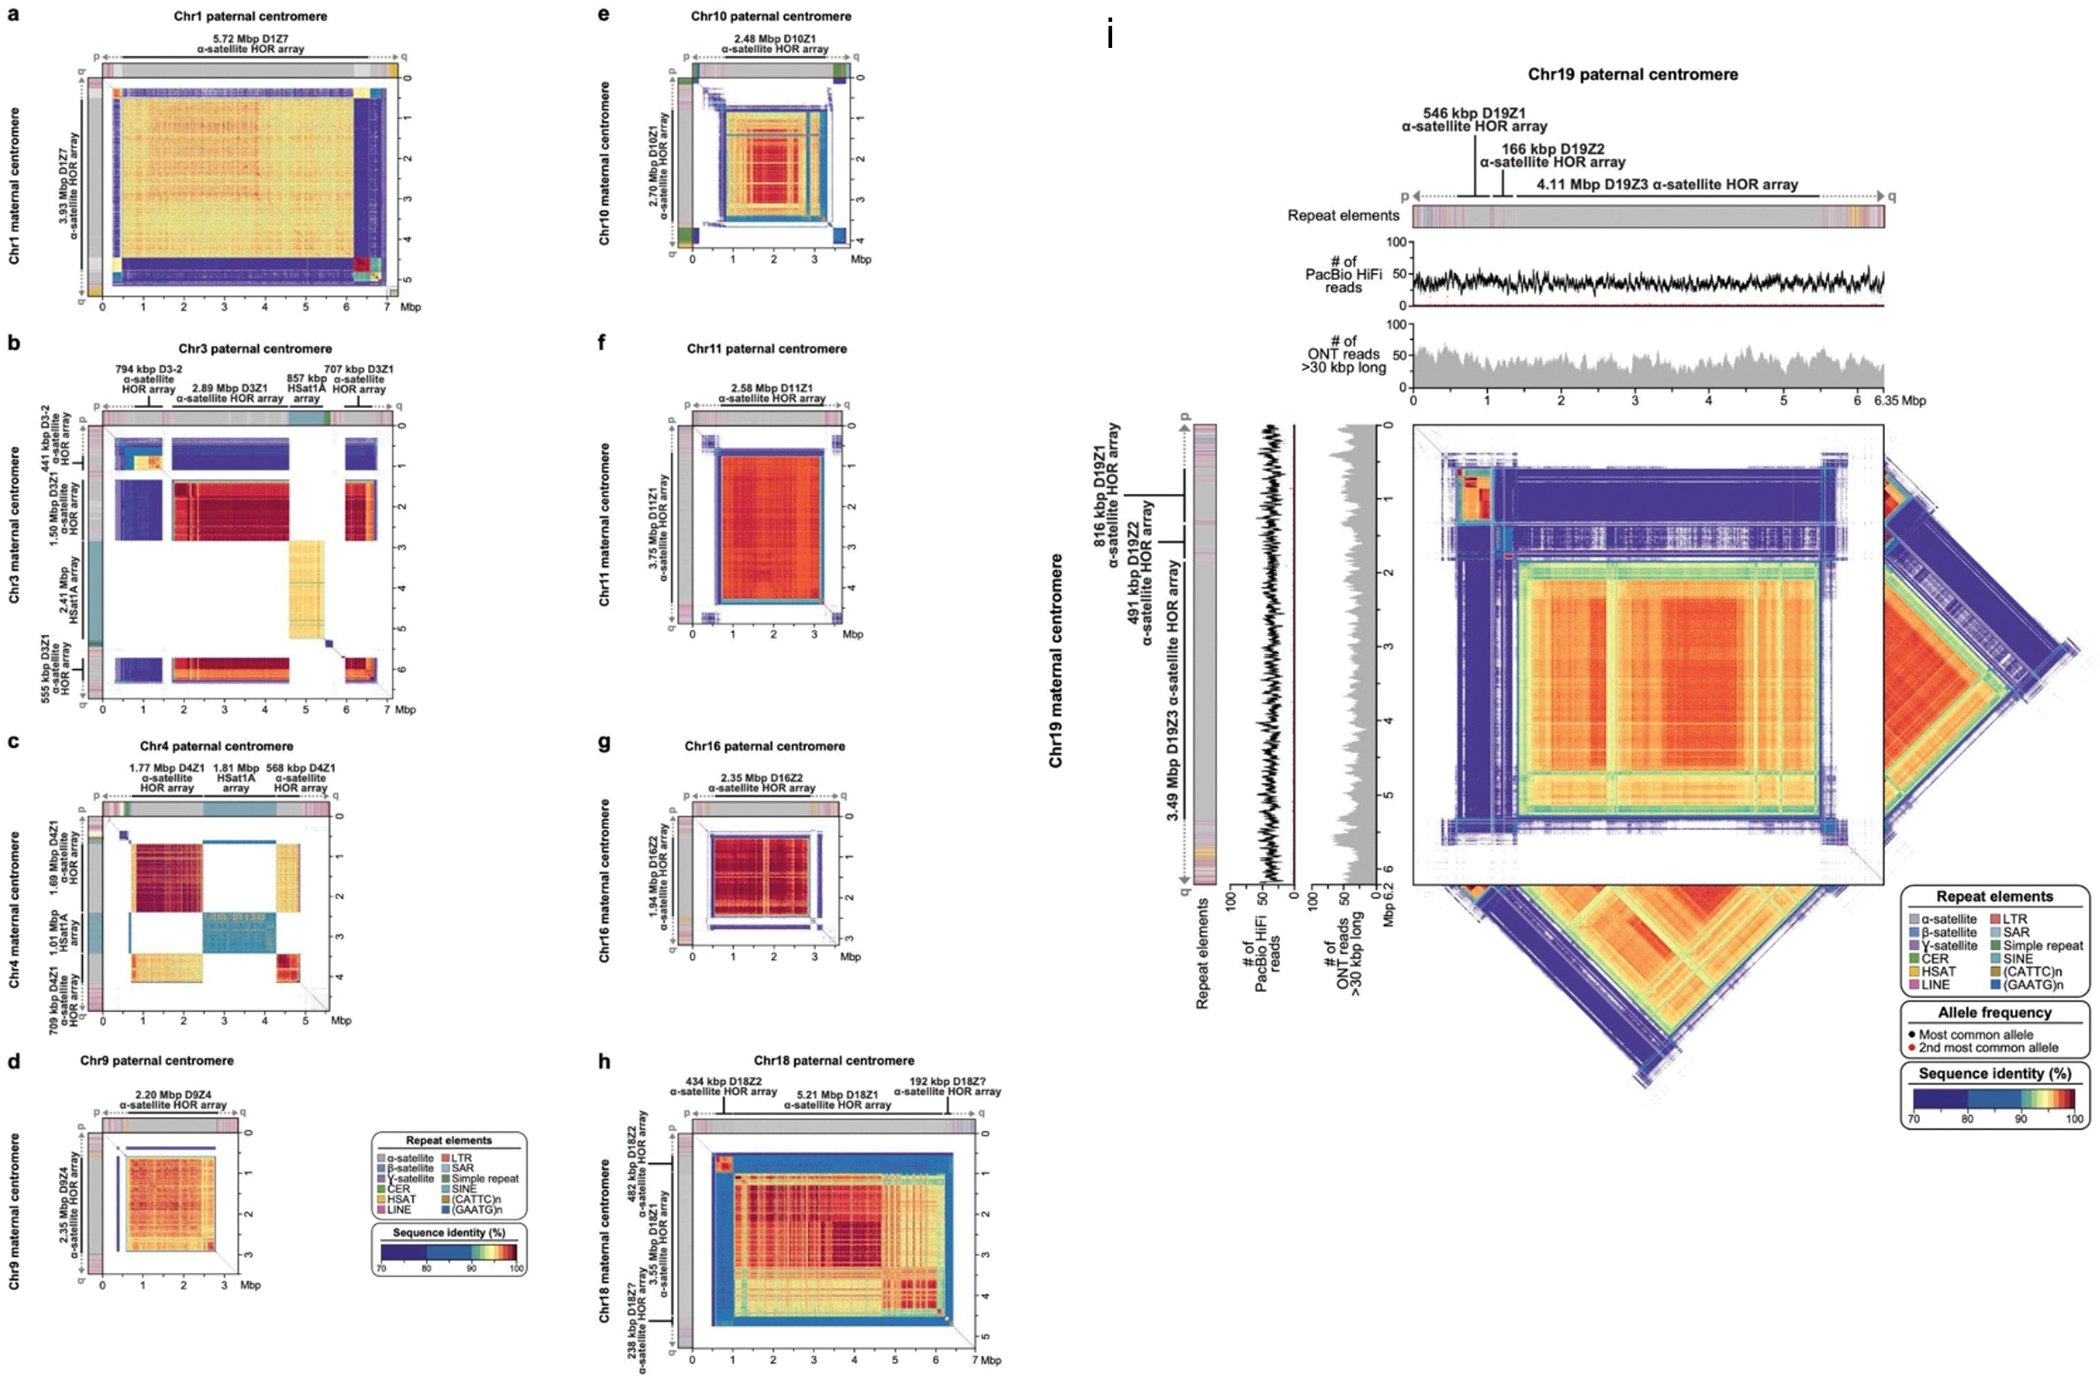
Extended Data Figure 9. Comparison of the HG002 maternal and paternal full-coverage Verkko trio assemblies for the centromeric regions of chromosomes 1 (a), 3 (b), 4 (c), 9 (d), 10 (e), 11 (f), 16 (g), 18 (h), and 19 (i) in the HG002 genome.

The plots show the similarity between the two haplotypes, with the maternal haplotype on the y-axis and the paternal on the x-axis. The centromeric regions show varying ɑ-satellite HOR array sizes and sequence identity between the two haplotypes, consistent with earlier reports that indicate that centromeric HOR arrays often expand and contract due to their repetitive nature and their propensity for unequal crossing over 84–86 and gene conversion 87 events. For Chromosome 19, as in Figure 4, the tracks show the repeat annotations and read coverages. The triangles show the self-similarity within each haplotype for comparison.
