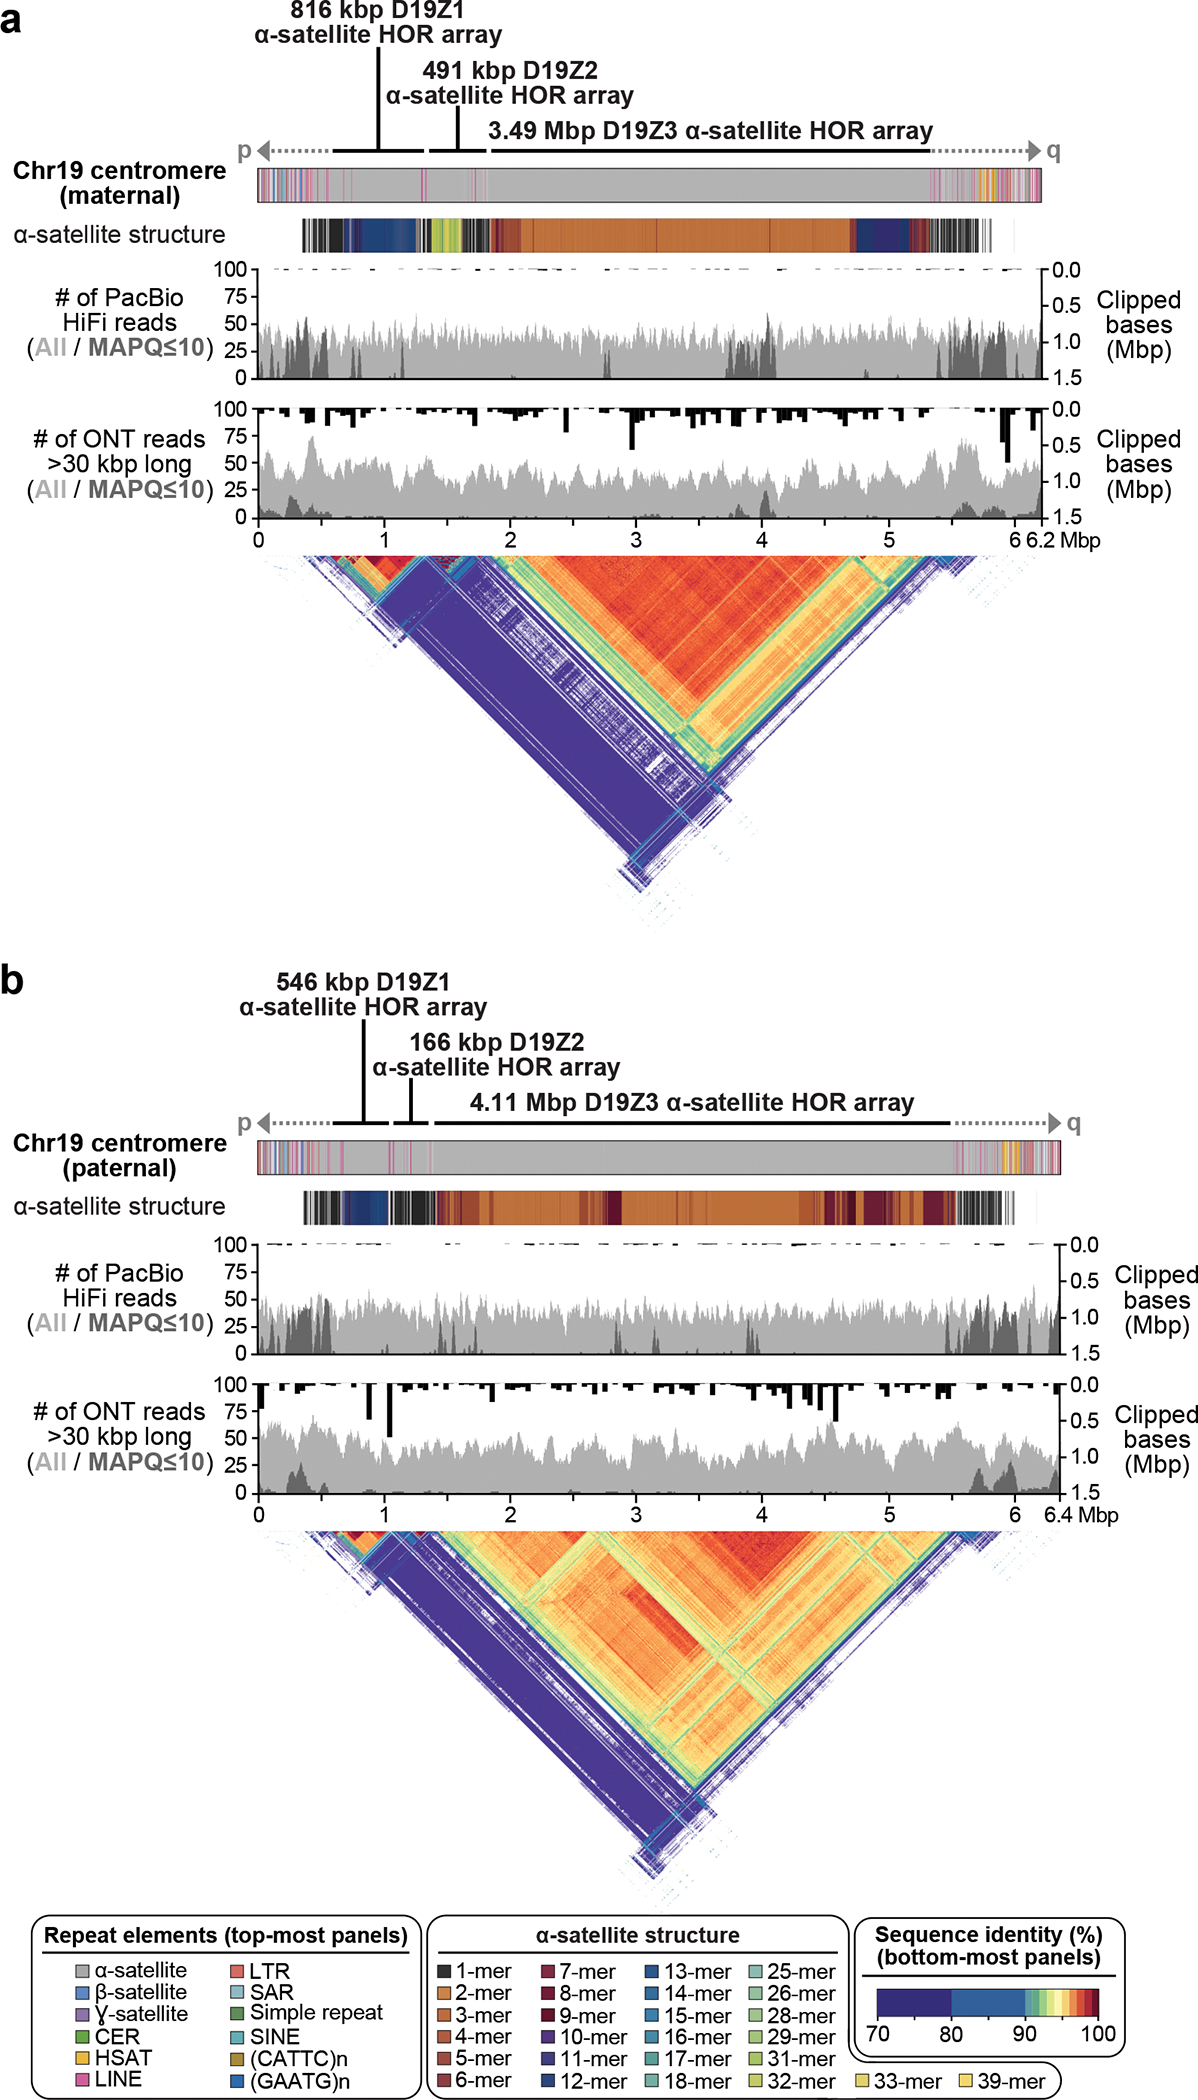
Figure 4. Comparison of the maternal (a) and paternal (b) Chr19 centromeric regions in HG002.

Each haplotype is annotated with its repeat structure (top-most track), HOR structure, PacBio HiFi coverage, and ONT coverage. Dark gray indicates reads with low mapping quality, which may be due to either mis-assembly or repetitive regions in the genome. Bars indicate the sum of clipped bases within each window along the assembly (Supplementary Table 9). Last, the triangle, corresponding to the upper-triangular portion of a dot-plot rotated so the diagonal is the x-axis and colored by identity, shows sequence similarity within each haplotype 63. Both haplotypes reveal the presence of three higher-order repeat (HOR) arrays (D19Z1, D19Z2, and D19Z3) that vary in size and structure.
