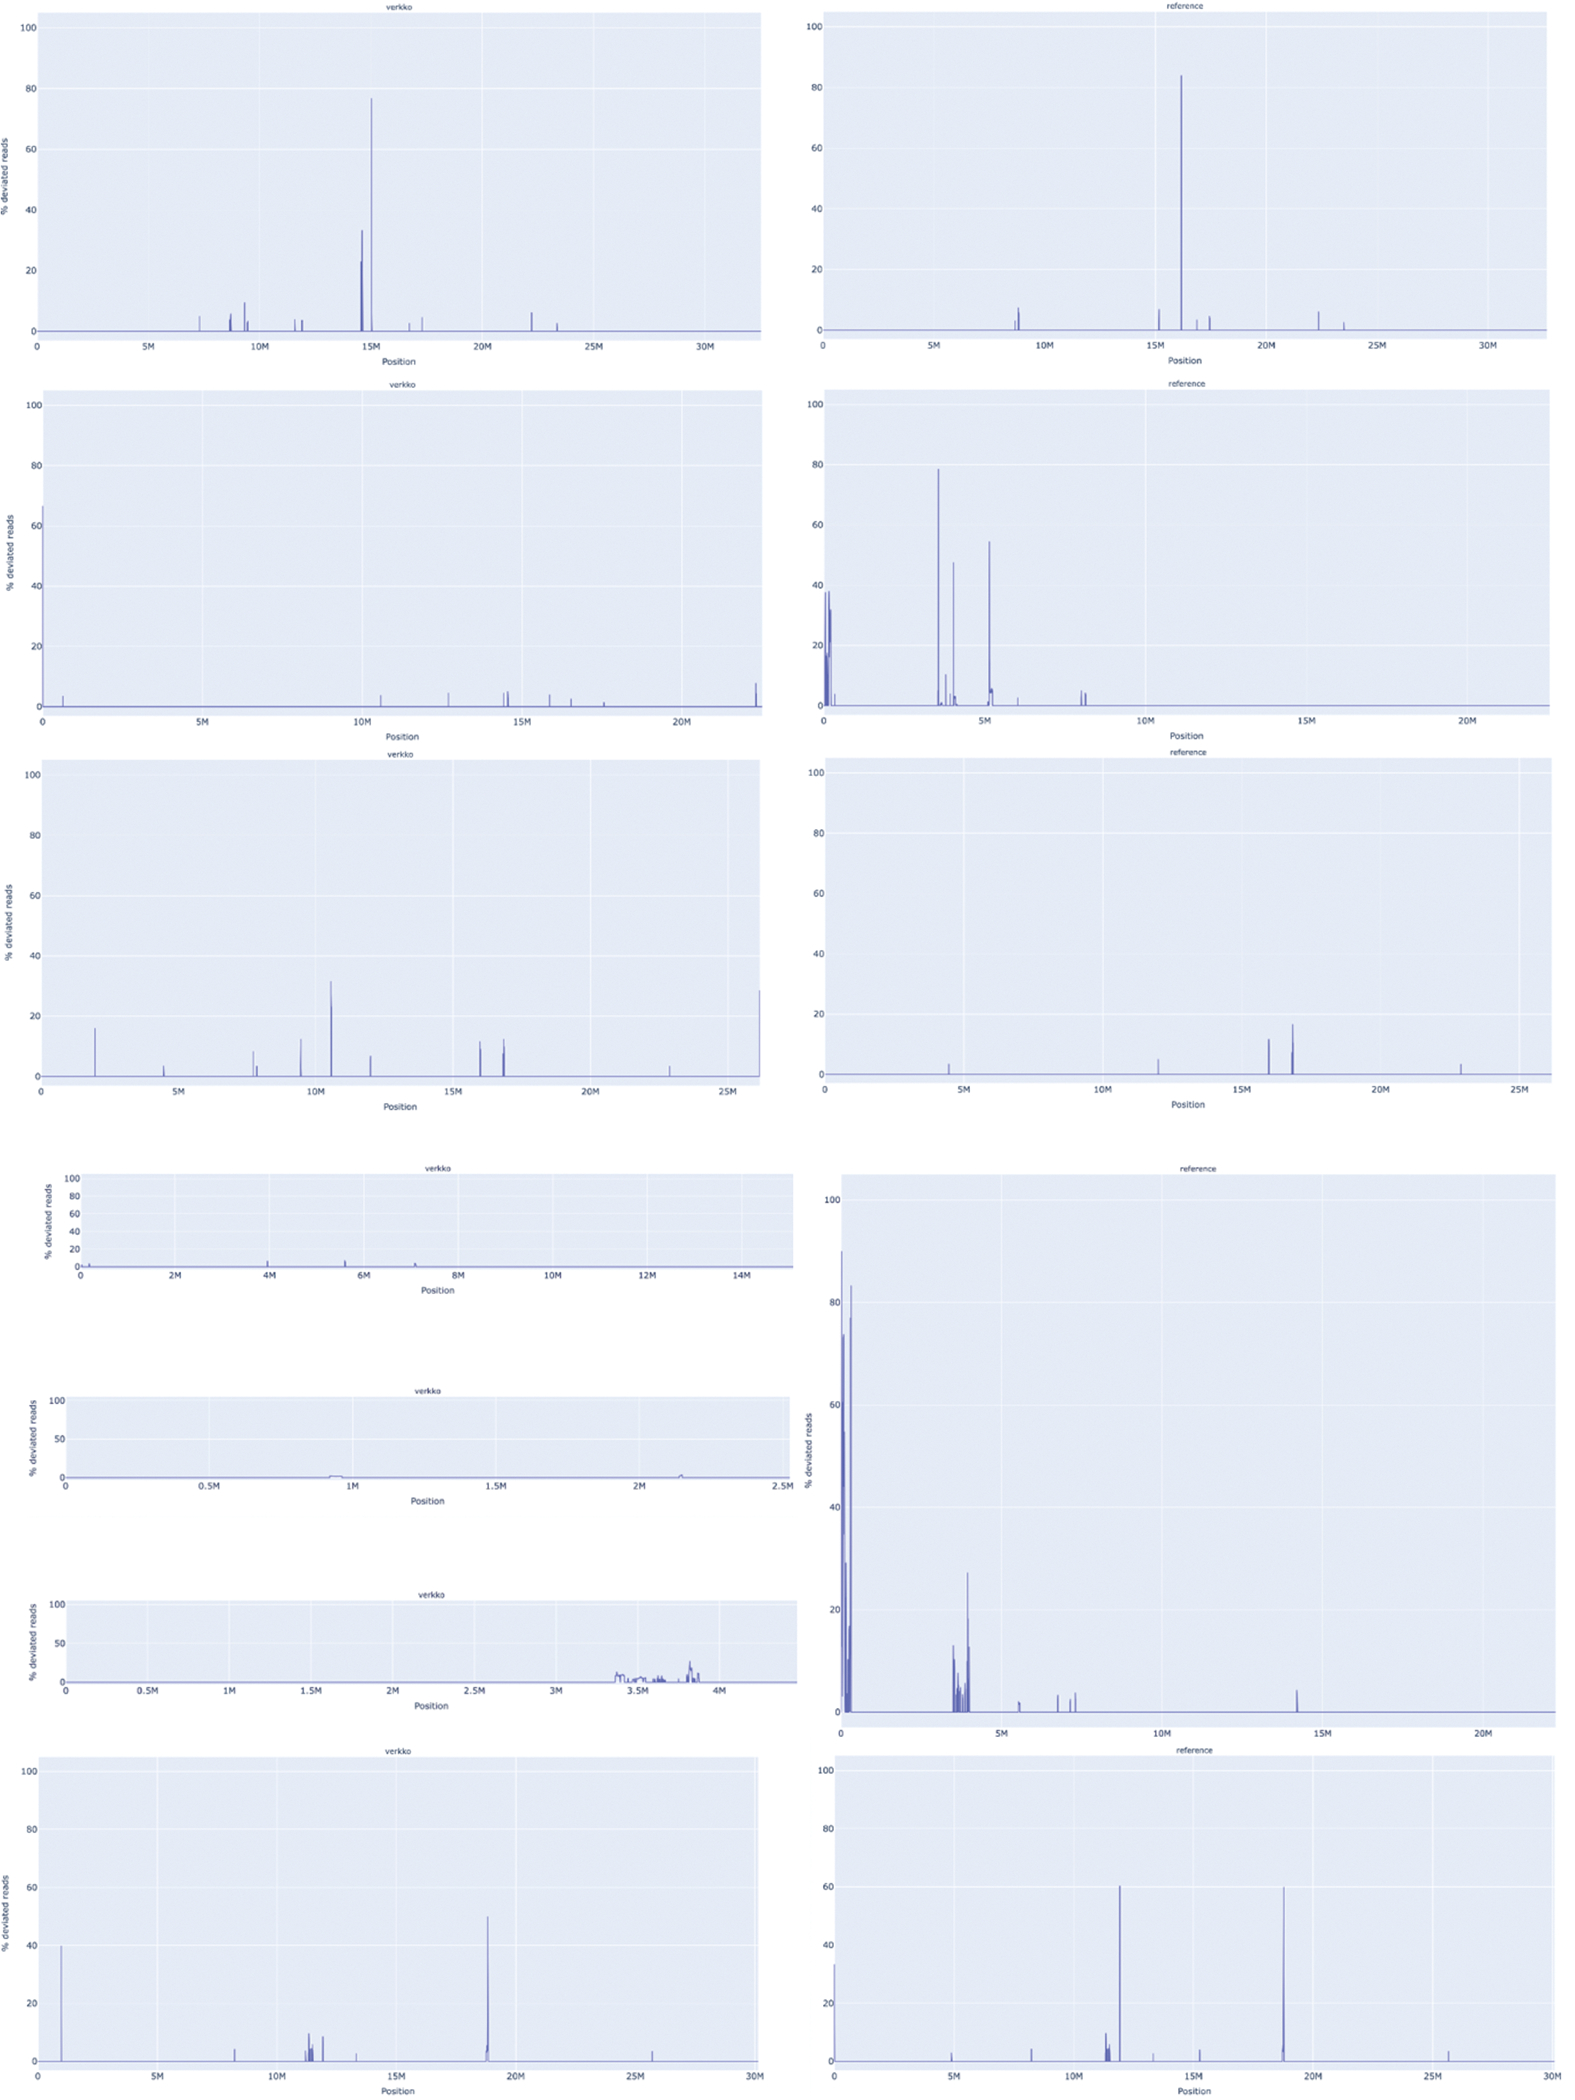
Extended Data Figure 1. A. thaliana chromosome unitigs in Verkko (left) vs published assembly chromosomes evaluated by VerityMap (right).

From top to bottom, Chr1, Chr2, Chr3, Chr4, and Chr5. VerityMap compares the spacing of unique k-mers within the HiFi reads to the spacing observed in the assembly. Whenever there is a disagreement, the plot shows a spike at the discrepant location. The x-axis indicates the coordinates along the assembly contig or scaffold while the y-axis shows the fraction of disagreeing reads (0–100%). A disagreement greater than 50% is likely not a heterozygous variant but a true error in the assembly. The BED file produced by VerityMap also indicates the size of the discrepancy, estimated from the difference in k-mer spacing between the reads and the assembly.
