
Extended Data Figure 4. Merqury 58 haplotype blob plots.
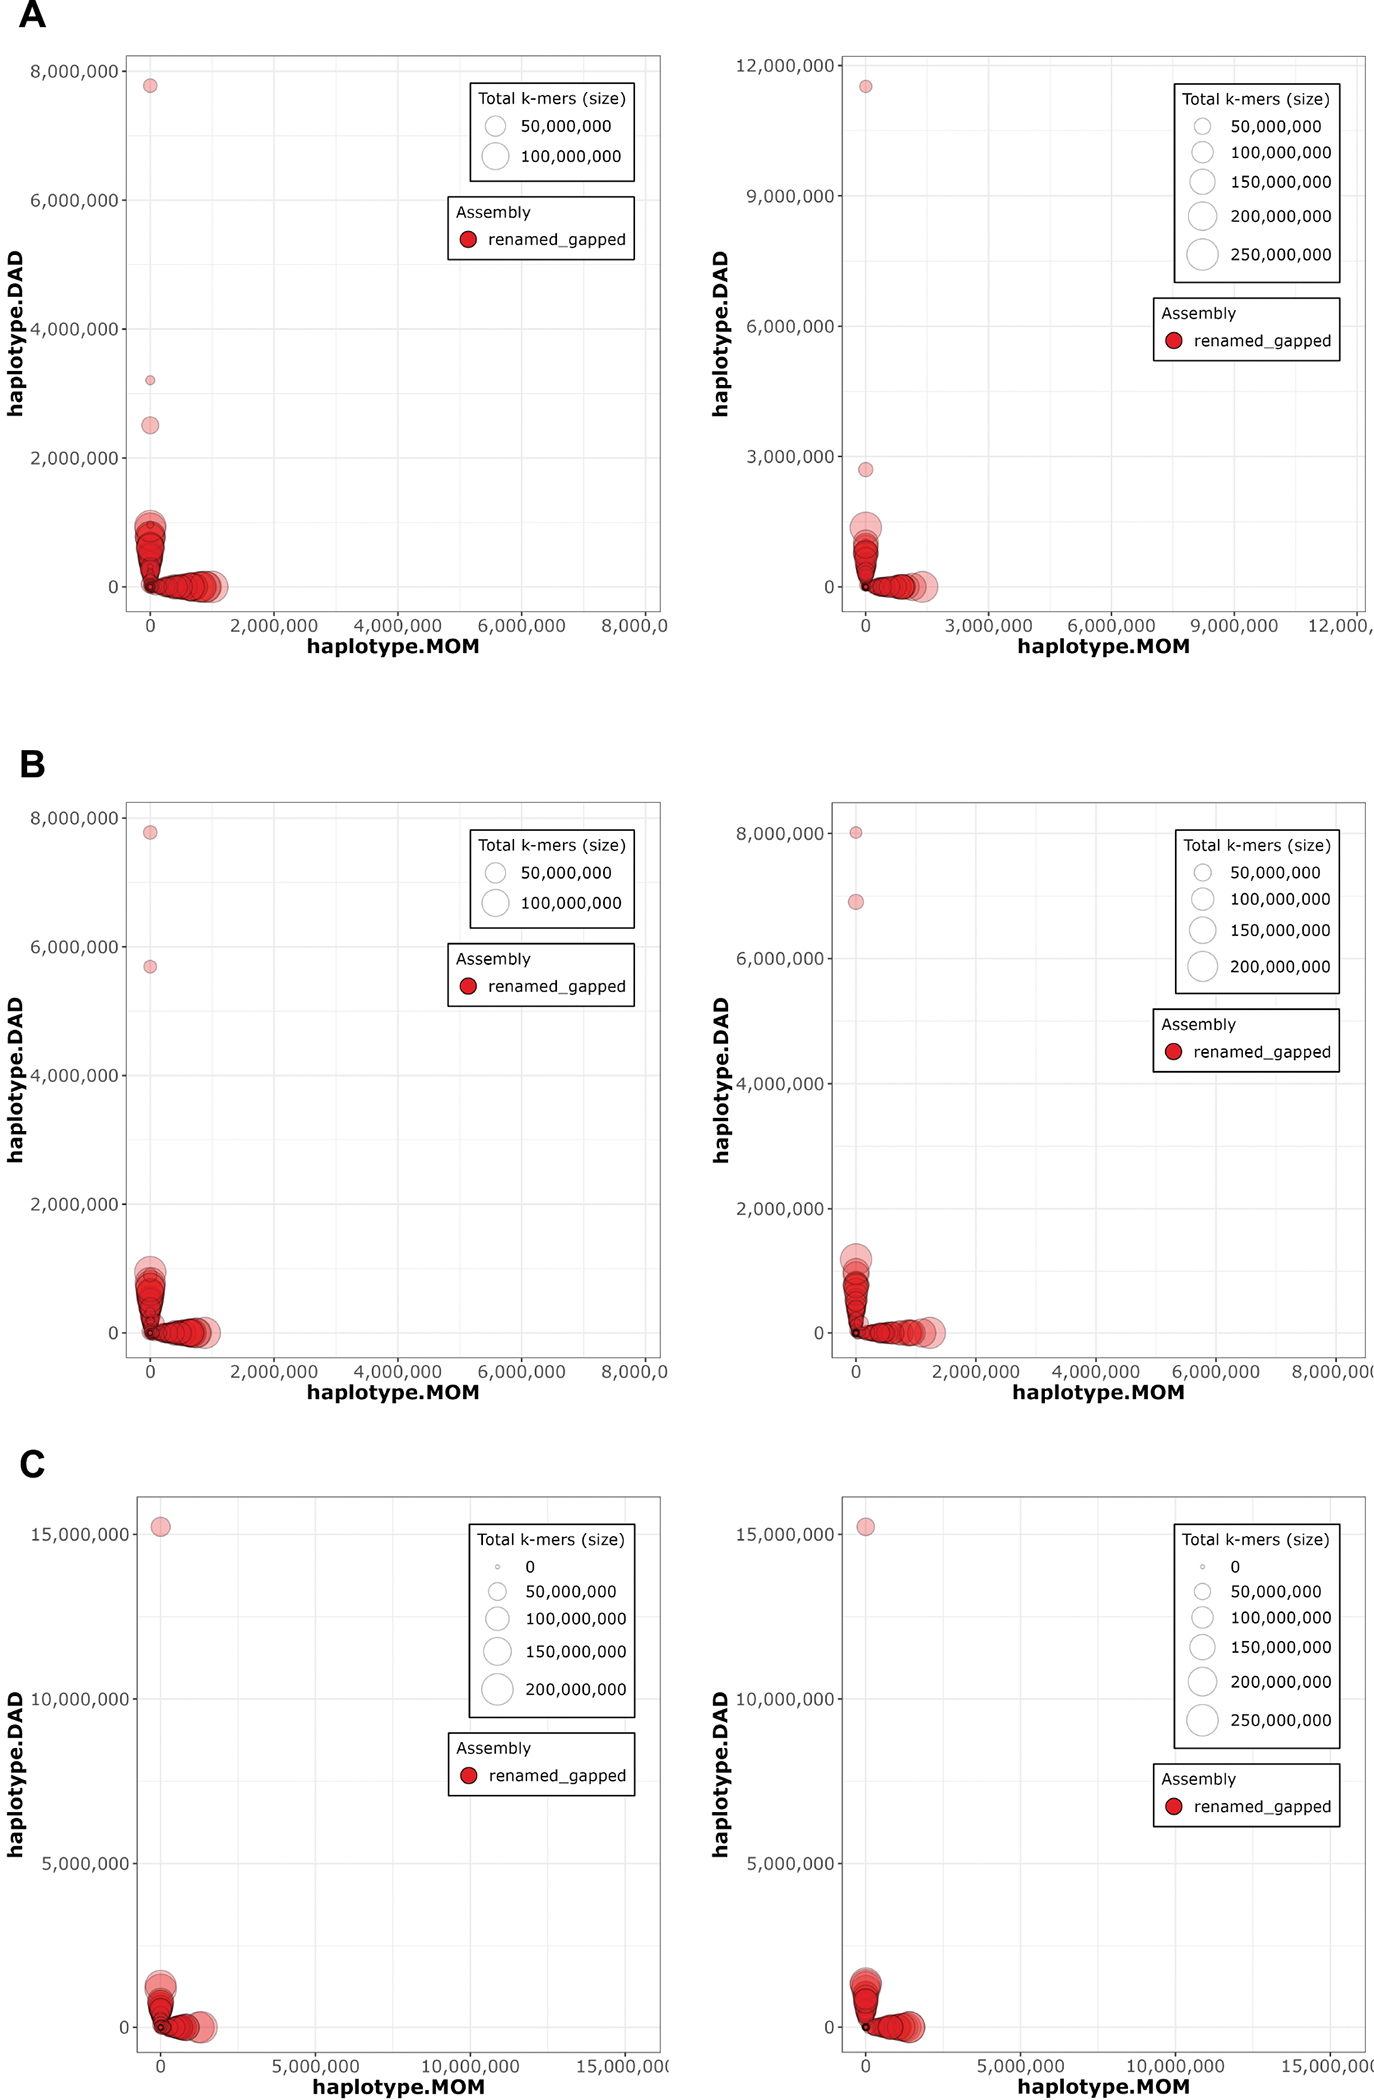
A. HG002 downsampled Verkko B. HG002 downsampled DeepConsensus HiFi Verkko and C. HG002 full-coverage Verkko assemblies. The Hi-C phased assembly is on the left and the trio-phased assembly is on the right. Each contig/scaffold is a circle on the plot, with the size scaled based on contig/scaffold length. The x-axis shows the number of maternal markers while the y-axis shows the number of paternal markers. Contigs which lie along either the x-axis or y-axis show no haplotype errors and are consistently maternal or paternal. Contigs which mixed haplotypes would appear along the diagonal but are not observed in these plots, indicating an accurately phased assembly.