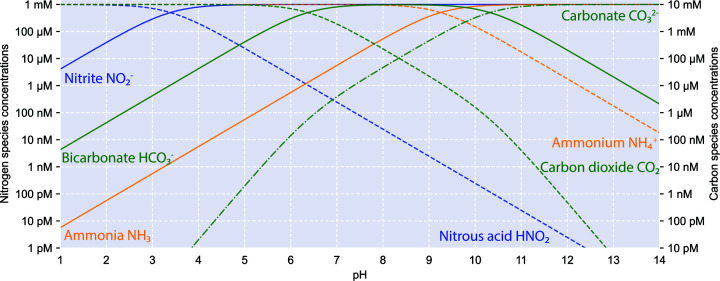
Figure 2. Comparisons of concentrations of nitrogen and carbon sources for nitrifying microorganisms from pH 1 to 14.
These comparisons are based on pKa values (NH4+/NH3 = 9.25, HNO2/NO2− = 3.39, CO2/HCO3− = 6.37, HCO3−/CO32− = 10.32), calculated using 1 mM total concentration for ammonia (orange, solid) and ammonium (orange, dashed); nitrite (blue, solid) and nitrous acid (blue, dashed); and 10 mM total concentration for bicarbonate (green, solid), carbon dioxide (green, dashed) and carbonate (green, dash dot).

