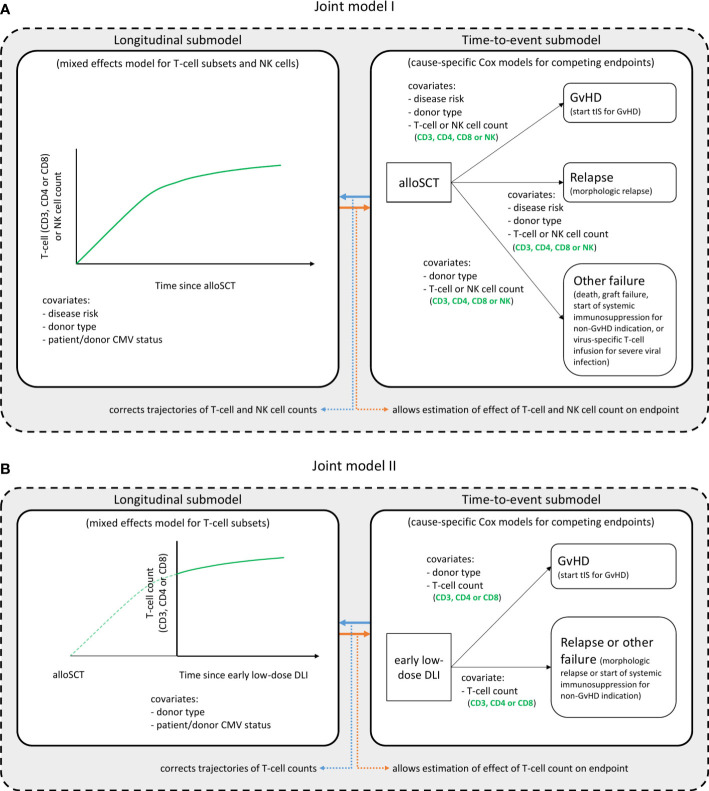
Figure 1.
Structure of the joint models. Graphical description of the two joint models. Joint model I (A) starts at time of alloSCT, joint model II (B) at time of the early low-dose DLI. Each model consists of a longitudinal and a time-to-event submodel and was run in turn for each T-cell subset, considering either the CD3+, CD4+ or CD8+ T-cell counts, and the NK cell counts. These are the outcome of the longitudinal submodel and a time-dependent covariate in the time-to-event submodel. All other variables in each submodel are baseline covariates. Per endpoint of the time-to-event submodels, the clinical events that occurred during the relevant time period (first 6 months after alloSCT or first 3 months after the early low-dose DLI) are described. The NK cells were only analyzed in model I. See the Statistical Supplement for a detailed description of the model structures.

