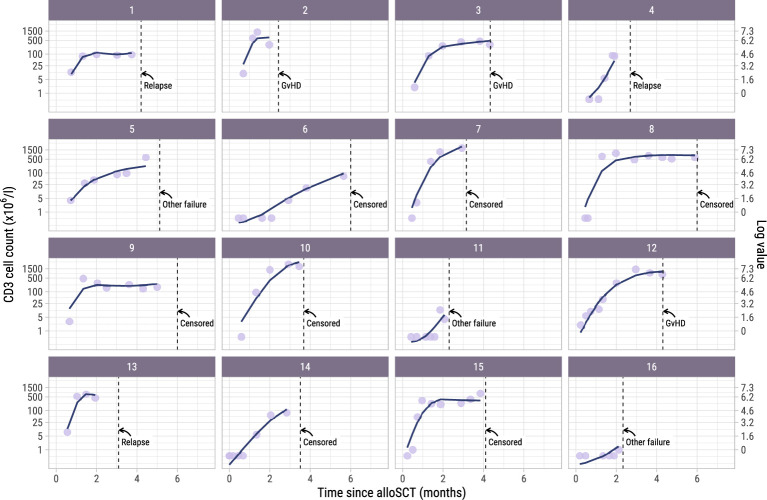
Figure 2.
Observed versus estimated CD3 counts from alloSCT. Observed (dots) and estimated subject-specific trajectories (solid line) of a random subset of 16 patients in the dataset. The estimated trajectories are based on the longitudinal submodel of model I. Dotted lines show the time of terminating event or administrative censoring because of administration of a modified T-cell product or standard DLI. The secondary axis shows the cell counts on the log scale, which is the scale used for modelling. For example, a cell count of 1 on the primary axis corresponds to log(1) = 0 on the secondary axis.

