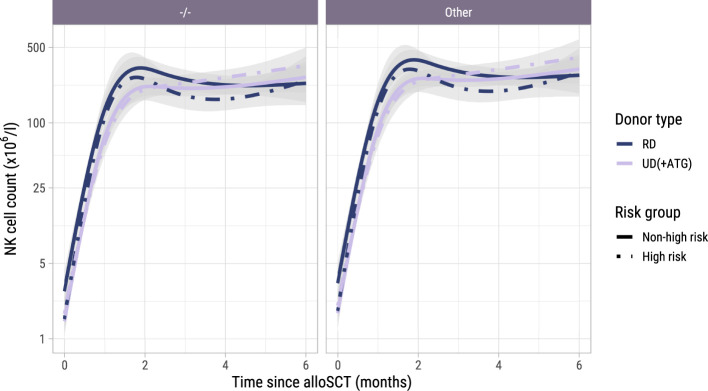
Figure 7.
Model-based NK cell count trajectories after alloSCT. Predicted average trajectories of the NK cell counts during the first 6 months after alloSCT, based on the longitudinal submodel of model I. The left panel shows the predicted trajectories for CMV seronegative patients with a CMV seronegative donor, the right panel the predicted trajectories for patients with any other patient/donor CMV serostatus combination. 95% confidence intervals are shown in grey.

