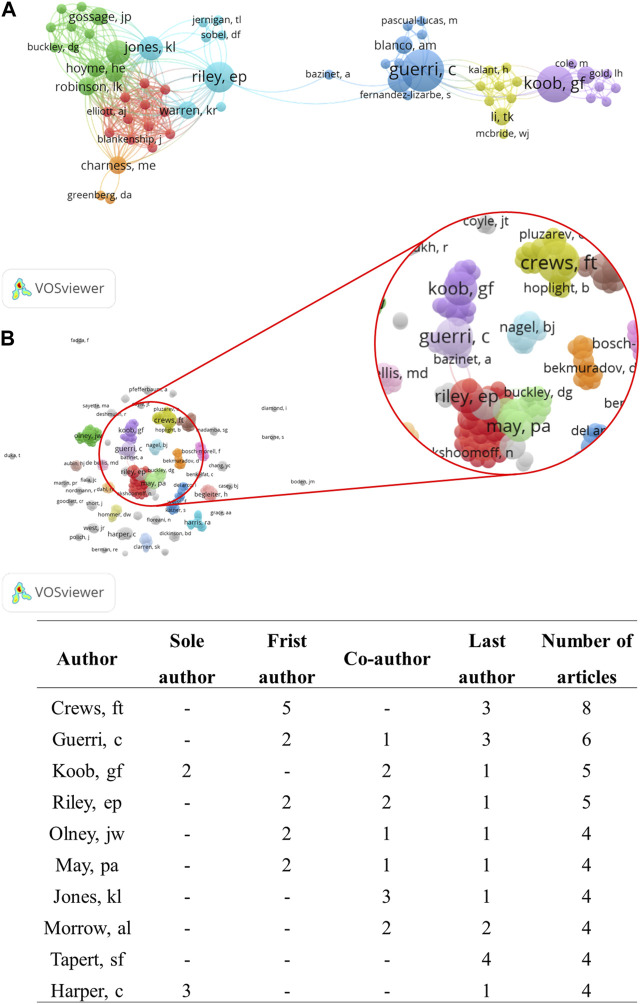
FIGURE 5.
Network visualization of co-authorship: (A) The largest set of connected authors (n = 72 authors); (B) All authors with at least one papers (n = 371authors), showing the authors with the largest number of articles published about the neurotoxicology of alcohol. The node size represents the number of documents: the larger the node, the greater the number of articles. Clusters are represented by different colors and the lines indicate co-citation links between authors.

