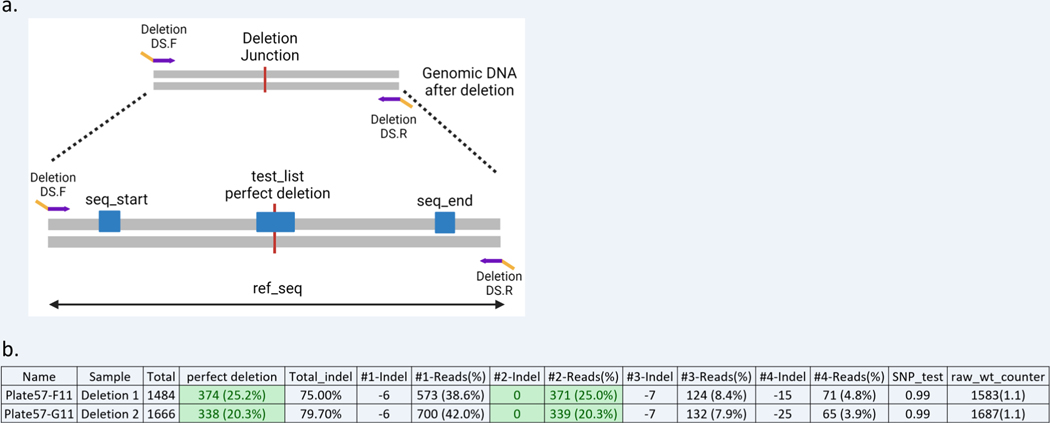
Figure 10: Set up and analysis of CRIS.py data for a deletion project.
(a) Example of a deletion product and the variables used in the CRIS.py program for deletion analysis. The red line indicates the joining after the deletion event occurred. The gene specific portion of the primers is shown in purple, and the DS tags in yellow. The variables in the script are shown as blue boxes. (b) Example of a .csv output file for a deletion project analysis by CRIS.py. Two representative deletion pool samples are shown.

