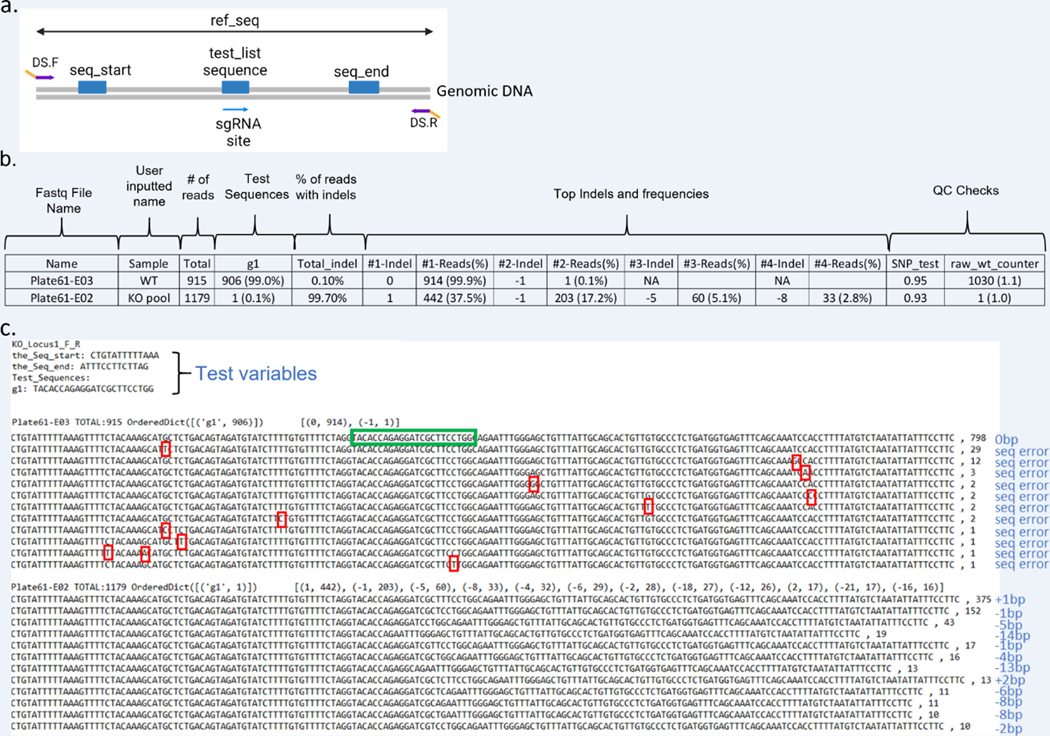
Figure 8: Set up and analysis of CRIS.py data for a KO project.
(a) Representation of the region of interest and CRIS.py variables in a KO project. The primers to amplify the targeted region are DS.F and DS.R. The gene-specific portion of the primers is shown in purple and the DS tags in yellow. The seq_start, seq_end and test_list sequences to be included in the CRIS.py script are shown as blue boxes. (b) Example data from a .csv file generated by CRIS.py analysis of a KO cell pool with features high-lighted. (c) Example data from a .txt file generated for CRIS.py-analyzed KO pool samples. The sgRNA (g1) sequence is shown in a green box. Indels and sequencing errors in the sample are labeled in blue text. Sequencing errors (seq error) in the WT sample are marked by red boxes.

