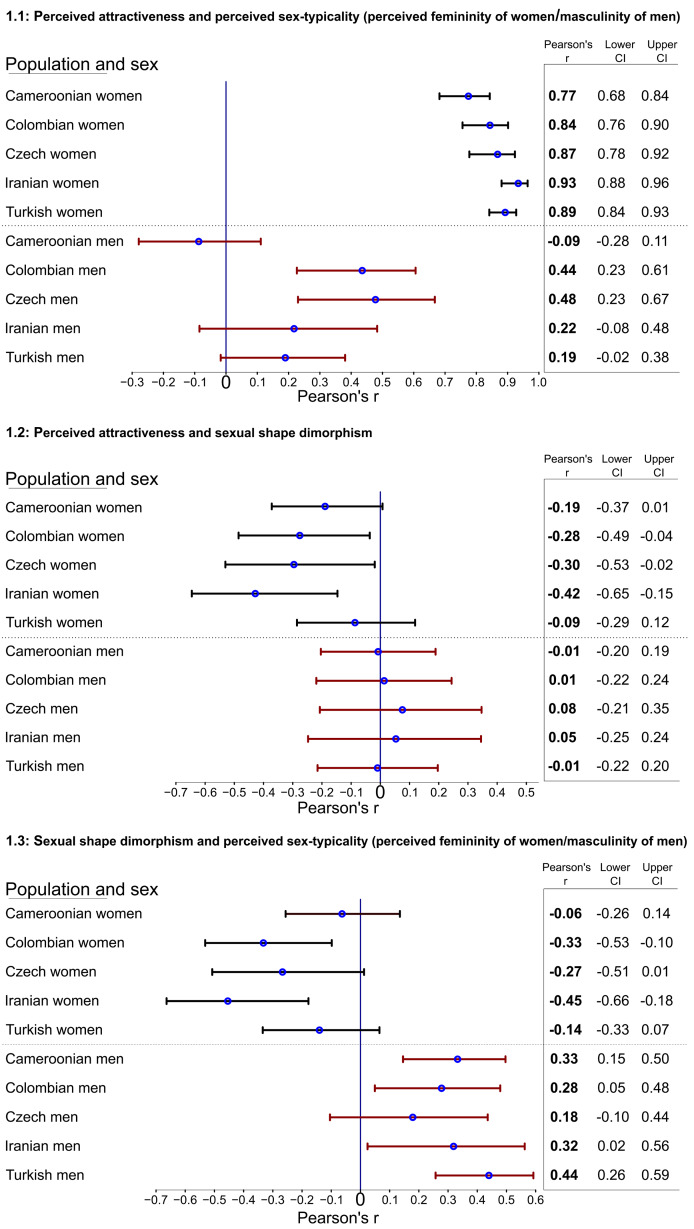
Figure 1.
Forest plots displaying the relative strength of Pearson's correlations between perceived attractiveness and perceived sex-typicality (a), perceived attractiveness and sexual shape dimorphism (b) and between sexual shape dimorphism and perceived sex-typicality (c), with confidence intervals of each coefficient. Each row corresponds to a single sample (women from all five samples, men from all five samples, with sampled countries in alphabetical order). Blue circles represent Pearson's correlation coefficients (mean estimate on the given sample), while black lines stand for error bars defined as 95% confidence intervals around each mean correlation. A vertical line in zero (‘0’) enables us to inspect whether the confidence interval for a given correlation contains zero. The columns on the right side of the diagrams show coefficients of the associations. This figure facilitates a comparison of bivariate associations among the population samples.

