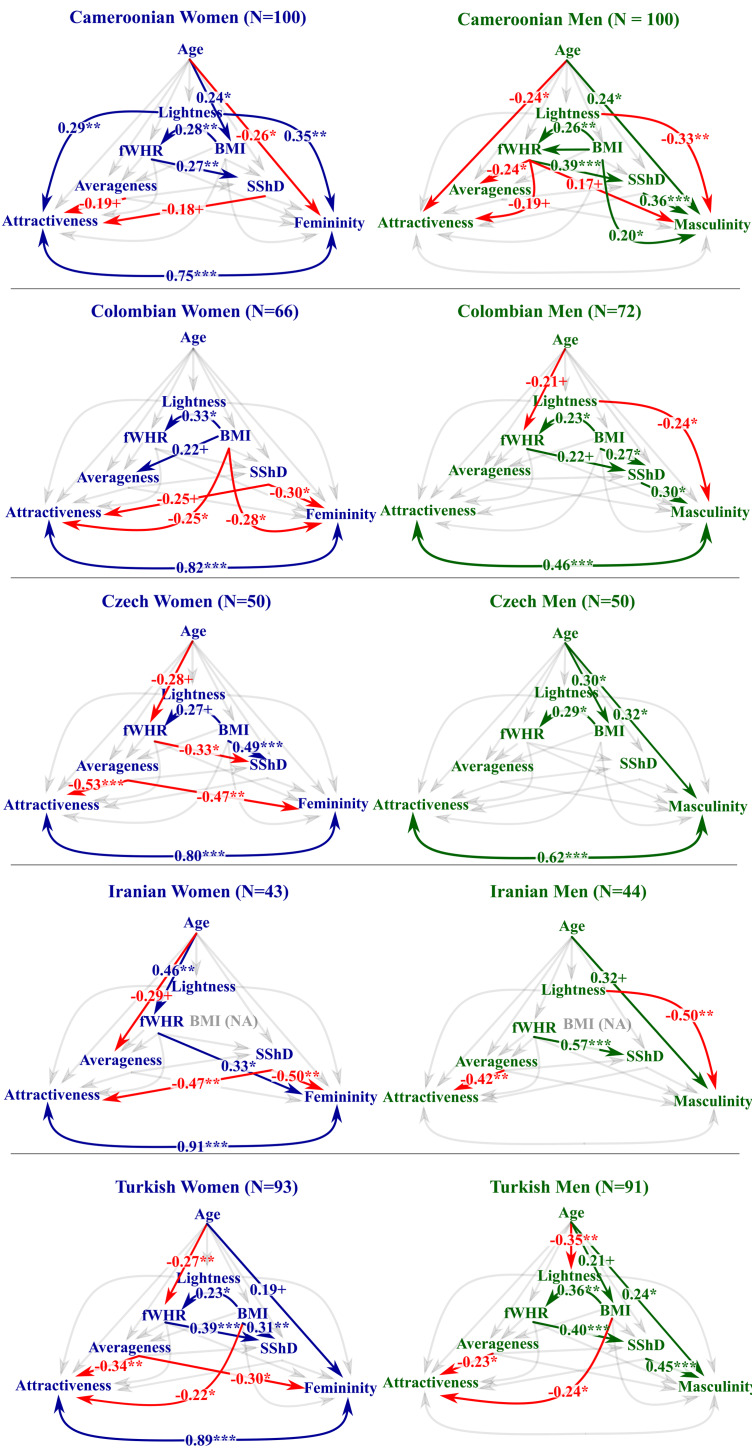
Figure 2.
A visualisation of path analyses (multiple regression models) between the rated facial attributes (perceived sex-typicality and attractiveness) and facial measures ordered by the sex of the stimuli. Arrows represent the direction of the association. Non-significant paths are omitted. Association between perceived sex-typicality and attractiveness was treated as a correlation (i.e. the direction was not specified). Numbers next to the paths indicate the estimate of regression or correlation coefficient in a corresponding model with standardised variables. Red colour denotes a negative coefficient. The graph shows to what extent is the observed within-sample variability of each variable explained by other variable(s). In every sample, perceived femininity and attractiveness are closely mutually associated in the women's samples. In most population samples, perceived masculinity was not associated with perceived men's attractiveness. The significant paths mostly replicate significant Pearson's correlations (see Figure S4) (+ p < 0.10, *p < 0.05, ** p < 0.01, *** p < 0.001).

