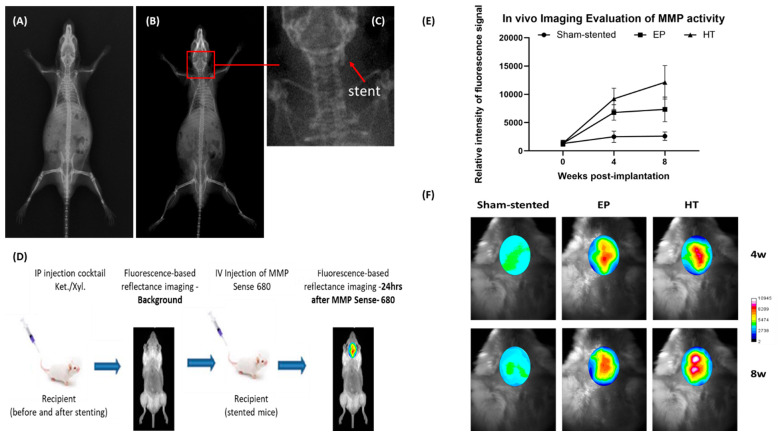
Figure 3.
Representative X-ray images of (A) control (before stenting) and (B) stented CD1 mouse. (C) Stent deployed in LCCA - shown at higher magnification. (D) Schematic diagram of the in vivo imaging protocol. (E and F) The MMP activity at the stent implantation site: (E) Relative intensity of the fluorescent signal (week 0 marks the background autofluorescence signal level) and (F) Representative images (in pseudocolor scale) of the n = 3 mice tested.

