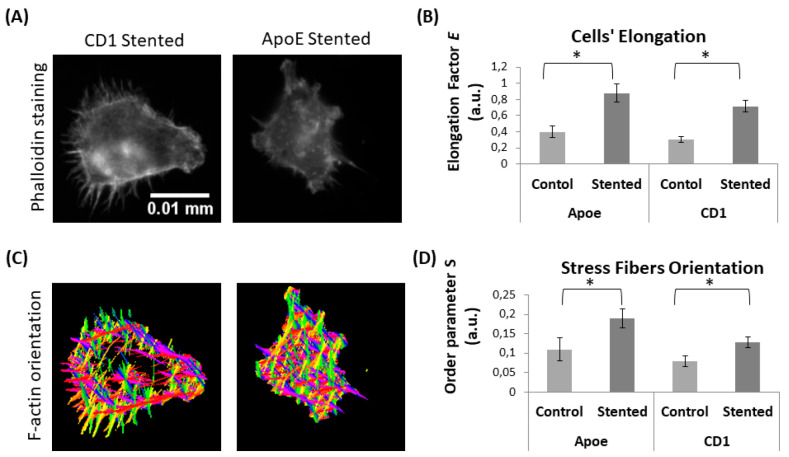
Figure 6.
Lymphocyte morphology in response to stent implantation. (A) Representative images of lymphocytes (from stented Apoe and CD1 mice) and (B) quantification of cell’s elongation. (C) Representative images of lymphocytes’ F-actin orientation and (D) quantification of F-actin fiber orientation in terms of order parameter S (S = cos2θ). (* indicates p < 0.05)

