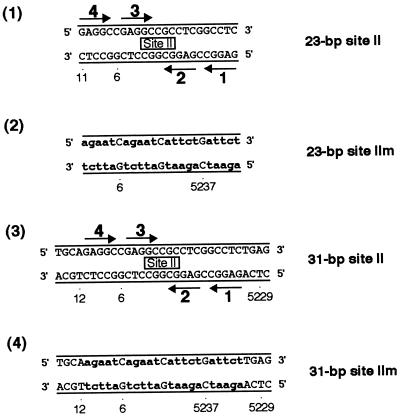
FIG. 1.
Sequences of the site II-based oligonucleotides. Diagrams 1 and 3 depict oligonucleotides containing site II, while diagrams 2 and 4 represent control oligonucleotides. The arrows depict the four GAGGC pentanucleotides within site II that are recognition sequences for T-ag, numbered as previously described (43). The names of the oligonucleotides are given to the right of each figure. Lowercase boldface letters in the control oligonucleotides represent the transition mutations (m) introduced into individual GAGGC pentanucleotides. SV40 sequences are numbered as described elsewhere (79).

