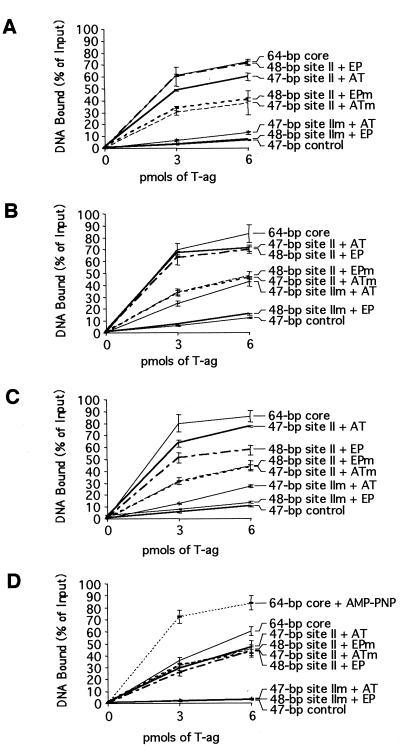
FIG. 10.
Filter binding assays used to measure the ability of T-ag to interact with the asymmetric extensions of site II set of oligonucleotides. The amount of oligonucleotide bound to T-ag was established by nitrocellulose filter binding assays and scintillation counting. The interactions of T-ag (0, 3, and 6 pmol) with these oligonucleotides were measured in the presence of ATP (A), AMP-PNP (B), or ADP (C) and in the absence of nucleotide (D). The names of the individual oligonucleotides are shown to the right of the figure.

