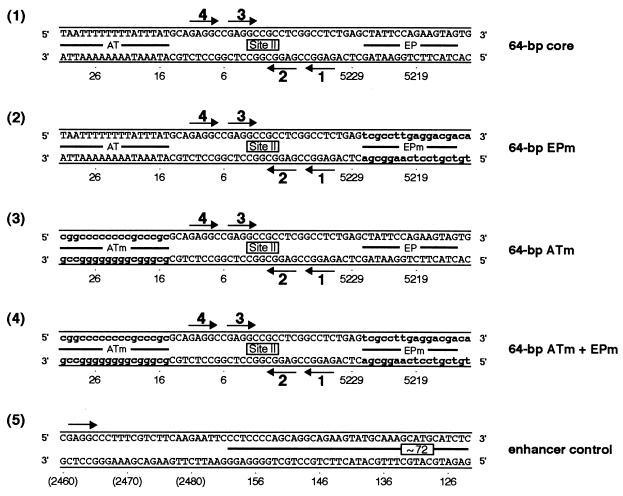
FIG. 3.
Sequences of the 64-bp core oligonucleotide and mutant forms of this molecule. The locations of the AT-rich regions, site II, and the EP regions are depicted. As in Fig. 1, the arrows depict the four GAGGC pentanucleotides within site II that serve as binding sites for T-ag. Lowercase boldface letters represent transition mutations (m) introduced into the indicated regions. The names of the individual oligonucleotides are given to the right of their sequences.

