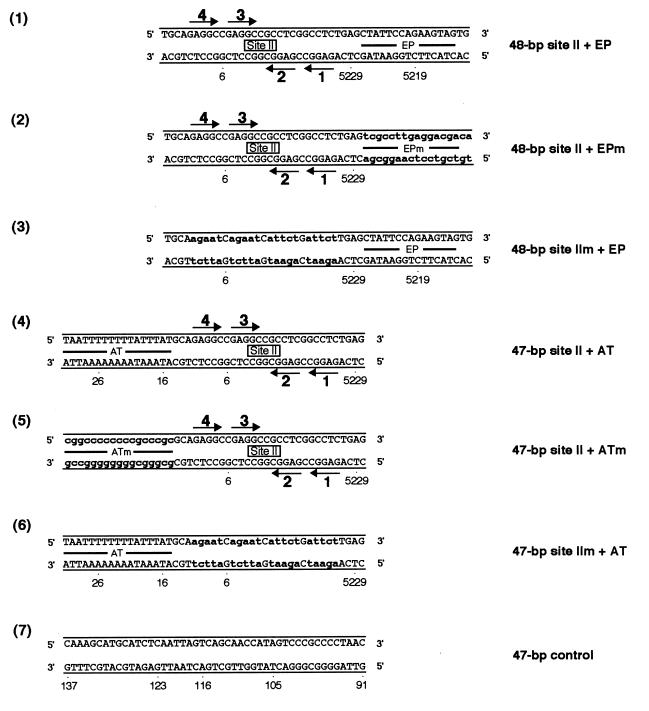
FIG. 8.
The set of oligonucleotides collectively termed the asymmetric extensions of site II; the names of the individual oligonucleotides are given to the right of their sequences. The locations of the AT-rich region, site II, and the EP region are depicted. As in previous examples, the arrows depict the four GAGGC pentanucleotides within site II that serve as recognition sites for T-ag. Diagram 1 presents the sequence of the oligonucleotide containing site II and the EP region, while diagram 4 presents the sequence of the oligonucleotide-containing site II and the AT region. Control oligonucleotides, containing transition mutations in the EP and AT regions, are depicted in diagrams 2 and 5, respectively. Additional control oligonucleotides, containing the wild-type EP and AT-rich regions and transition mutations in the pentanucleotides are depicted in diagrams 3 and 6, respectively. As in previous examples, lowercase boldface letters represent transition mutations (m) introduced into the indicated regions. Finally, the sequence of the 47-bp control oligonucleotide, used to measure non-sequence-specific binding, is presented in diagram 7.

