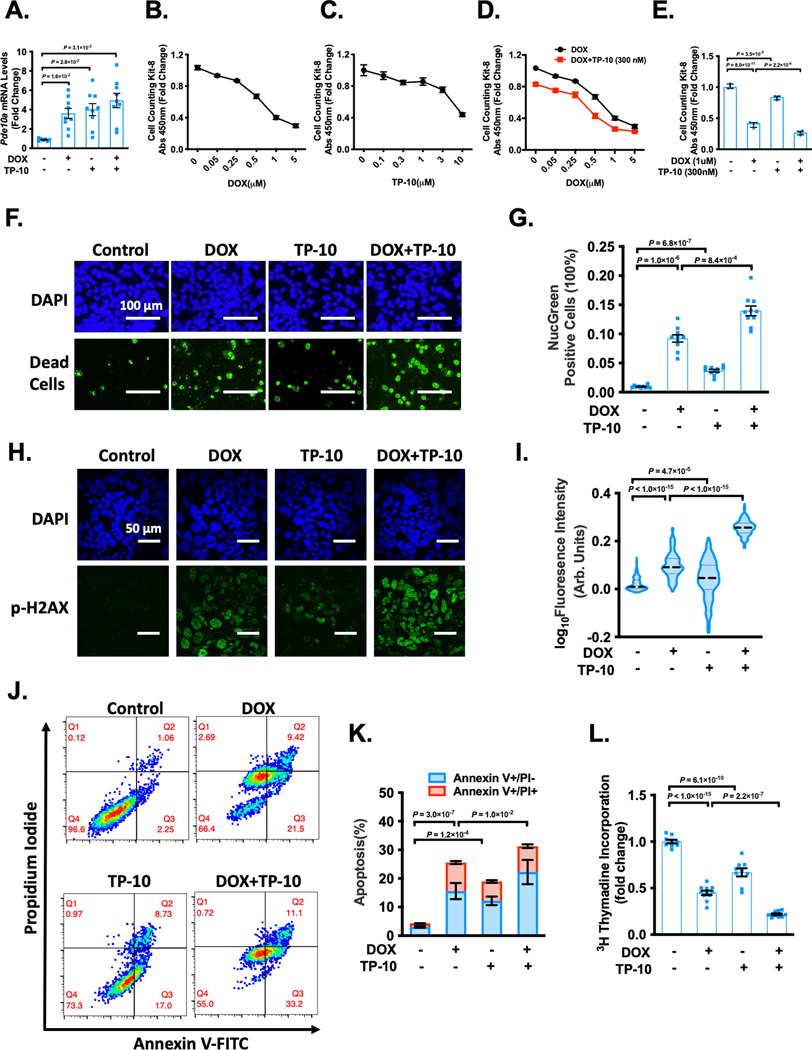
Figure 3: PDE10A inhibition enhanced DOX-induced ovarian cancer cell death/apoptosis and growth.
(A) Human ovarian cancer cell line A2780 were treated with vehicle, 300 nM TP-10, 1 μM DOX or combination of TP-10 and DOX as indicated for 6 hours. qPCR analysis of Pde10a, normalized to Gapdh, n = 5 replicates for each group. (B-E) Human ovarian cancer cell line A2780 were treated with vehicle or increasing dose of DOX (B), vehicle or increasing dose of TP-10 (C), 300 nM TP-10 plus vehicle or increasing dose of DOX (D), vehicle, 300 nM TP-10, 1 μM of DOX or combination of 300 nM TP-10 and 1 μM of DOX (E) as indicated for 24 hours. Cell viability was measured by cell counting kit-8 (CCK8) assay, n = 3 replicates for each group. (F-I) Human ovarian cancer cell line A2780 were treated with vehicle, 3 μM TP-10, 1 μM of DOX or combination of 3 μM TP-10 and 1 μM of DOX as indicated for 24 hours. (F) Representative images of cells stained with Dapi (total cells) and NucGreen (dead cells), scale bars: 100 μm. (G) Bars represent the percentage of NucGreen positive cells over the total cells. n = 10 random fields from 3 independent experiments for each group. (H) Representative images of immunostaining of p-H2AX, A2780 cells were fixed, and immunostained for p-H2AX, and counterstained for nuclei with DAPI. Scale bars: 50 μm. (I) Quantification of p-H2AX fluorescence intensity, n = 200–300 cells for each group. (J) A2780 cells were stained with annexin V-FITC and PI, the apoptotic cells were analyzed by a dot-plot using a flow cytometer. Q1, Annexin V-FITC−/PI+, necrosis; Q2, Annexin V-FITC+/PI+, late apoptosis; Q3, Annexin V-FITC+/PI−, early apoptosis; Q4, living cell population. (K) Quantification of the percentage of apoptotic cells (Annexin V+/PI− and Annexin V+/PI+), n = 6 replicates from 3 independent experiments for each group. (L) DNA synthesis measured via [3H]-thymidine incorporation in A2780 cells. n = 9–11 replicates from 3 independent experiments. Data were represented as mean ± SEM (A-D, G, K and L) or median with IQR (I). Statistics: Welch ANOVA with Dunnett’s T3 corrections for 3 comparisons in A and G, two-way ANOVA in D, one-way ANOVA with Holm-Sidak post-hoc test for 3 comparisons in E, K and L, Kruskal-Wallis’s test with Dunn’s corrections for 3 comparisons in I.

