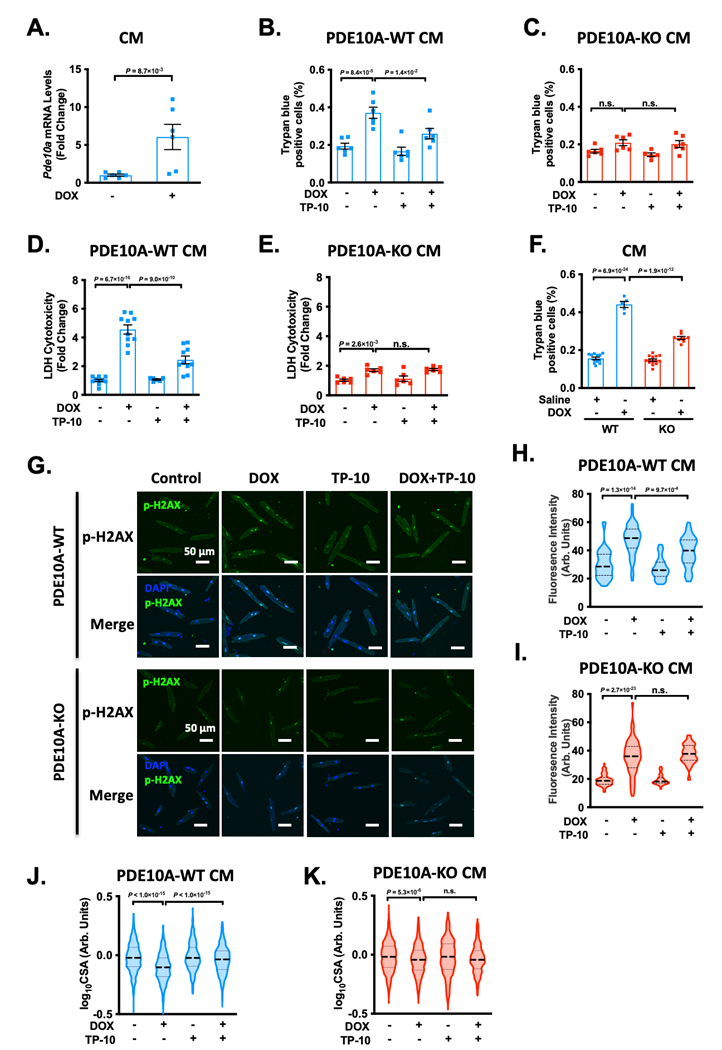
Figure 6: PDE10A inhibition or deficiency alleviates doxorubicin-induced cardiomyocyte death and atrophy in vitro.

(A) Cardiomyocytes (CMs) isolated from PDE10A-WT mice were stimulated with or without DOX for 6 hours. qPCR analysis of Pde10a, normalized to Gapdh, n = 6 replicates for each group. (B-K) CMs isolated from PDE10A-WT or KO mice were stimulated with 10 μM DOX in the presence of 300 nM TP-10 or vehicle for 24 hours. Cell death was measured in PDE10A-WT CMs (B) and PDE10A-KO CMs (C) by trypan blue staining, 20 random fields were assessed per treatment group, n = 6 replicates from 3 mice for each group. (D-E) Lactate dehydrogenase (LDH) cytotoxicity was quantified in PDE10A-WT (D) and PDE10A-KO (E) CMs, n = 6–10 replicates from 4 mice for each group. (F) PDE10A-WT or PDE10A-KO mice were treated with DOX (25 mg/kg by intraperitoneal injection (i.p.)) for 16 hours and CMs were isolated and cultured for 24 hours. Cell death was measured in by trypan blue staining, 20 random fields were assessed per treatment group, n = 5–14 replicates from 3 mice. (G) Representative images of immunostaining of p-H2AX, showing the effect of PDE10A inhibitor TP-10 on DOX stimulated mouse CM DNA damage. Mouse CMs were fixed, and immunostained for p-H2AX, and counterstained for nuclei with DAPI. Scale bars: 50 μm. (H-I) Quantification of p-H2AX fluorescence intensity in PDE10A-WT (H) or PDE10A-KO (I) CM, n = 50–80 CMs from 3 isolations. (J-K) Cell surface areas (CSAs) were quantified from CMs isolated from PDE10A-WT (J) and PDE10A-KO (K) mice. CSAs were averaged from n = 500–1500 myocytes from 3 isolations per group. Data were represented as mean ± SEM (B-F) or median with IQR (A, H-K). Statistics: Mann-Whitney test in A; mixed effect model with Sidak corrections for 2 comparisons in B-F, and H-K. n.s.: no significance difference.
