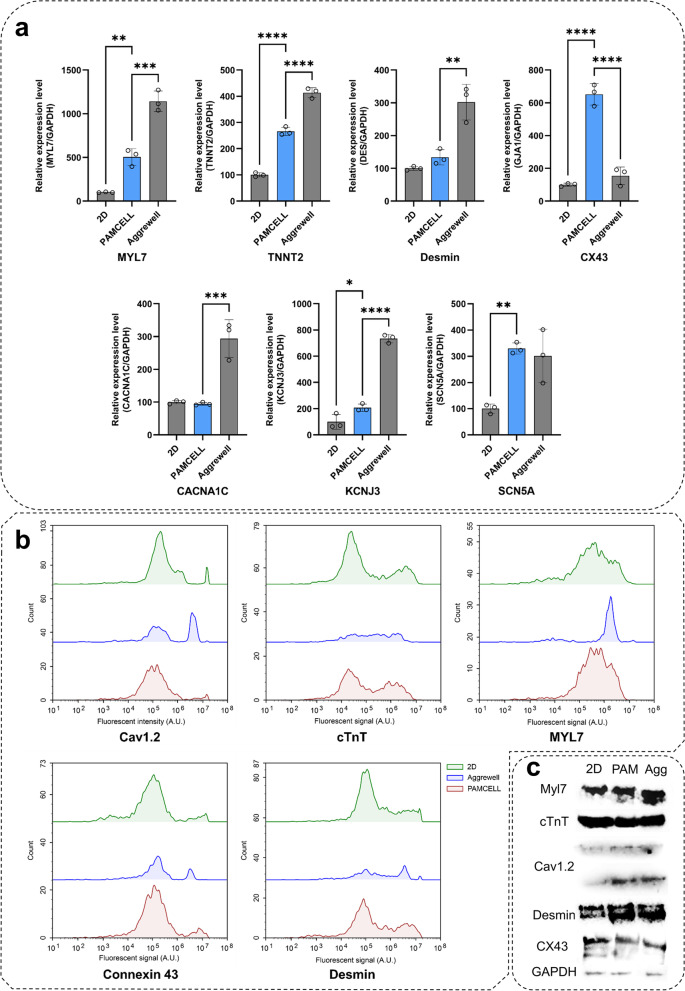
Fig. 7.
Quantification of of hiPSC 2D and 3D cardiomyocytes. (a) mRNA expression through real-time PCR analyses using primers for CM development markers (MYL7/TNNT2), gap junction/sarcomeric markers (CX43/DES), and the ion channel markers (CACNA1C/KCNJ3/SCN5A). Relative expression levels were normalized to those of GAPDH; (n = 3, *p ≤ 0.05, ** p ≤ 0.01, *** p ≤ 0.001, and ****p ≤ 0.0001); (b) 2D and 3D culture of hiPSC-CMs assessed by flow cytometric analysis; (c) Western blot experiments demonstrating the difference of the above markers in 2D vs. 3D cultures of hiPSC-CMs

