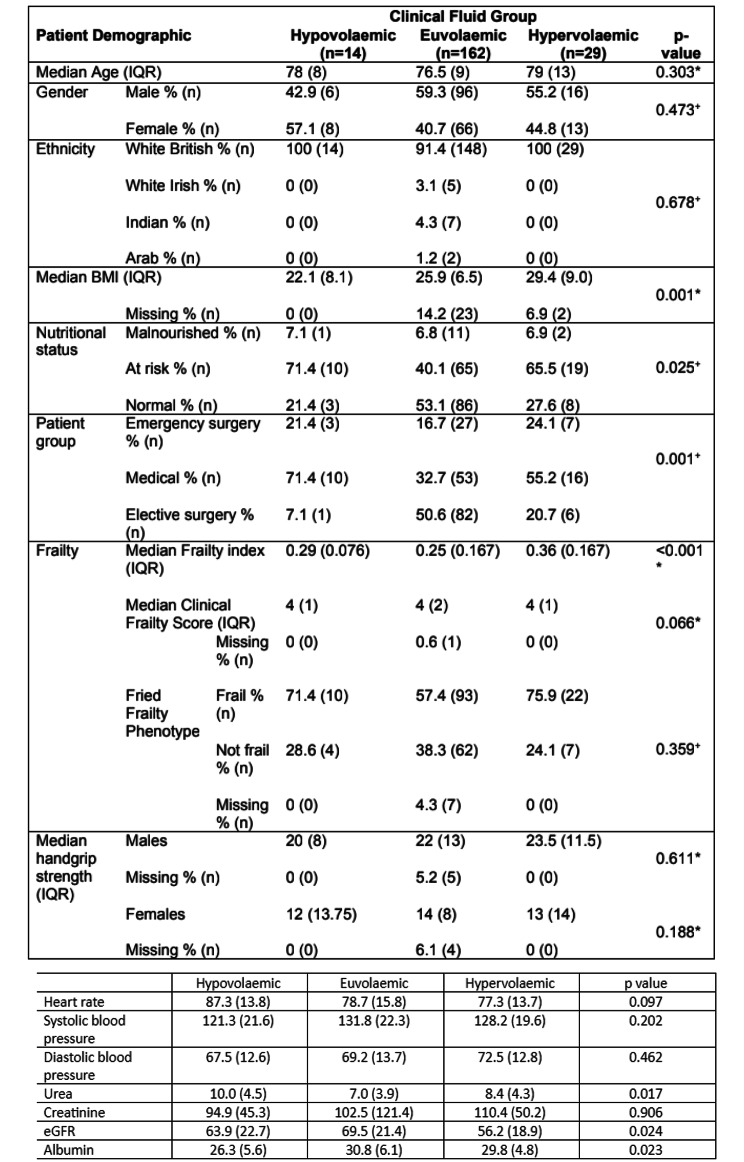
Fig. 3.
Summary of data acquired at patient assessments across all visits, divided by clinical fluid status. Hypovolaemic n = 14, Euvolaemic n = 162, Hypervolaemic n = 29. Nominal variables (gender, ethnicity, patient group, nutritional status and Fried Frailty Phenotype) are presented as percentage values and raw n values. Clinical Frailty Score, an ordinal variable, is summarised using median and interquartile range. Continuous data was tested statistically for normality using the Shapiro-Wilk test. Data for age, BMI, Frailty Index and handgrip strength did not follow a normal distribution and are therefore summarised as median values with interquartile ranges. * = p-value generated using Kruskal-Wallis test, + = p-value generated using Pearson’s chi-squared test

