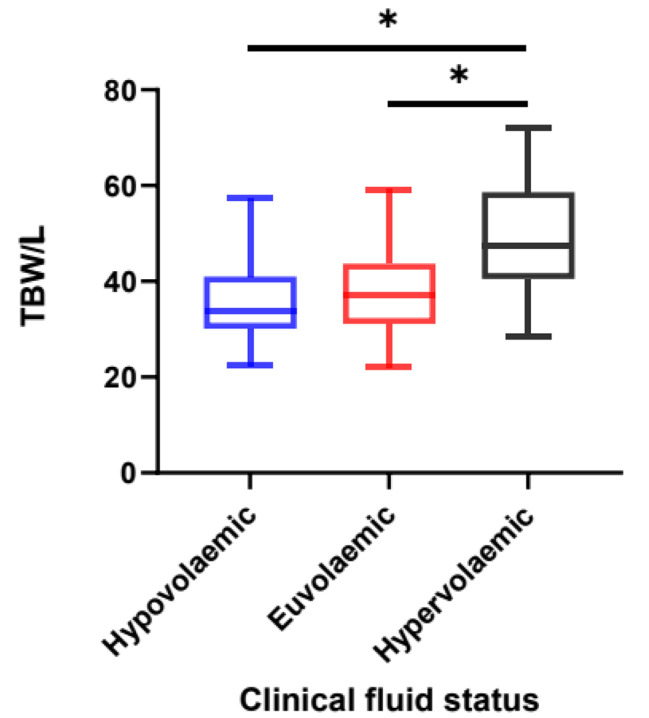
Fig. 4.

Box and Whisker plot demonstrating Total Body Water divided by clinical fluid status. Data acquired from BIA measurement and clinical assessment of fluid status across all patient assessments from all visits. Hypovolaemic n = 13, Euvolaemic n = 140, Hypervolaemic n = 25. The centre of each box represents the median value, with the box representing the IQR and the ‘whiskers’ representing minimum and maximum values. A non-parametric Kruskal-Wallis test was used to compare the differences between groups as the data was not normally distributed, with the Dunn’s test applied post-hoc. * = p < 0.05
