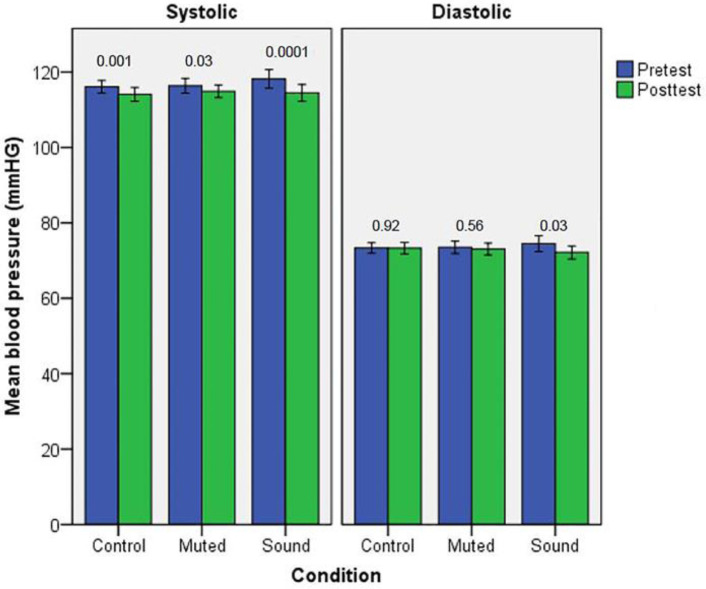
Figure 5.
Comparisons of mean blood pressure with paired samples t-tests of combined Study 1 and Study 2 participants indicated significant pre-post decreases in all conditions for systolic pressure and only in the sound condition for diastolic pressure
Note. p-values shown above bars; Error bars represent 95% CI

