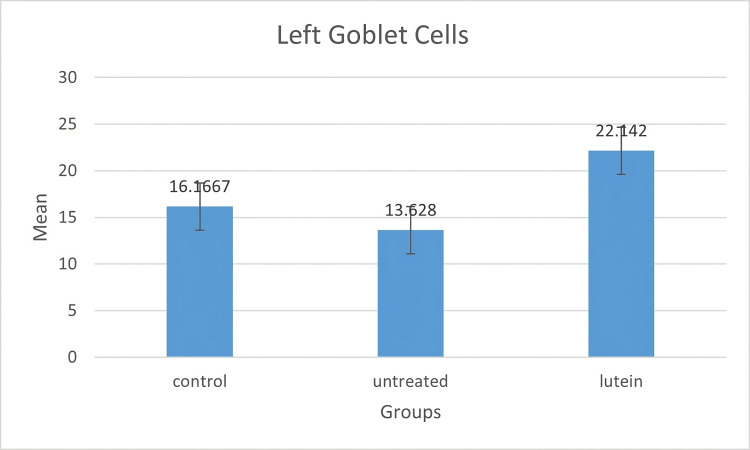
Figure 4. Diagram bar on goblet cell mean in the left eyes.
The mean of goblet cell density was measured in a number of goblet cell/field. There was a significant increase in the number of goblet cells in the lutein-treated group compared to the control group and the untreated group. No significant difference was noted between the control group and the untreated group in both eyes.

