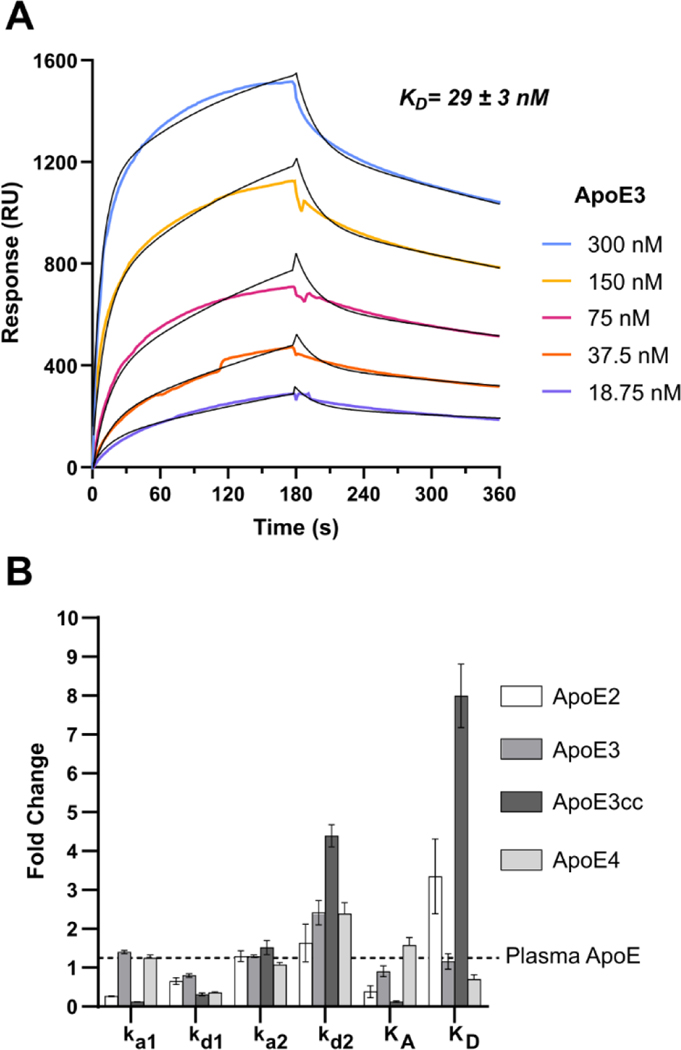
Figure 4.
Isoform Specific Kinetics of the ApoE/Heparin Interaction (A) The binding affinity of the ApoE-HS interaction was measured to be 29 nM by SPR binding kinetic assay for human ApoE3. The association and dissociation curve of different ApoE3 concentrations were fitted (black line) to a two-state reaction (conformational change) model. (B) A bar graph comparing the ApoE isoform kinetics constants relative to recombinant ApoE3. Error bars are ± SEM.

