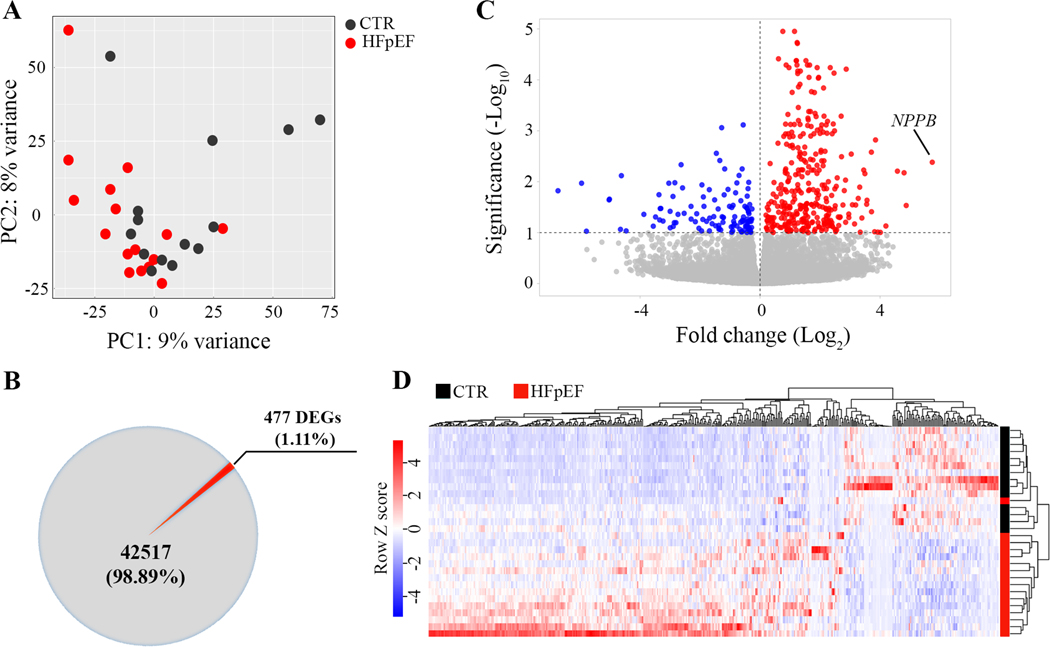
Figure 1. Differential gene expression analysis.
A, Principal component analysis of all identified genes shows the overlaps and differences between the RNA-Seq transcriptome profiles between left ventricular myocardium from referent controls (CTR, ●) and HFpEF (●). First principal component (PC1) is shown on x-axis while the second principal component (PC2) is shown on y-axis. B, Pie chart for differentially expressed genes (DEGs) identified between CTR and HFpEF. C, Volcano plot with the log2 fold change in gene expression in HFpEF on the x-axis. The red and blue circles represent significantly up- and down-regulated genes on the y-axis. The B-type natriuretic peptide (NPPB) gene encoding BNP is markedly upregulated in HFpEF. D, Heat map of RNA-seq expression data showing the hierarchical clustering of genes that are differentially expressed between control and HFpEF. Z-scores for each of the 477 DEGs were calculated and used as input for complete linkage clustering analysis.

