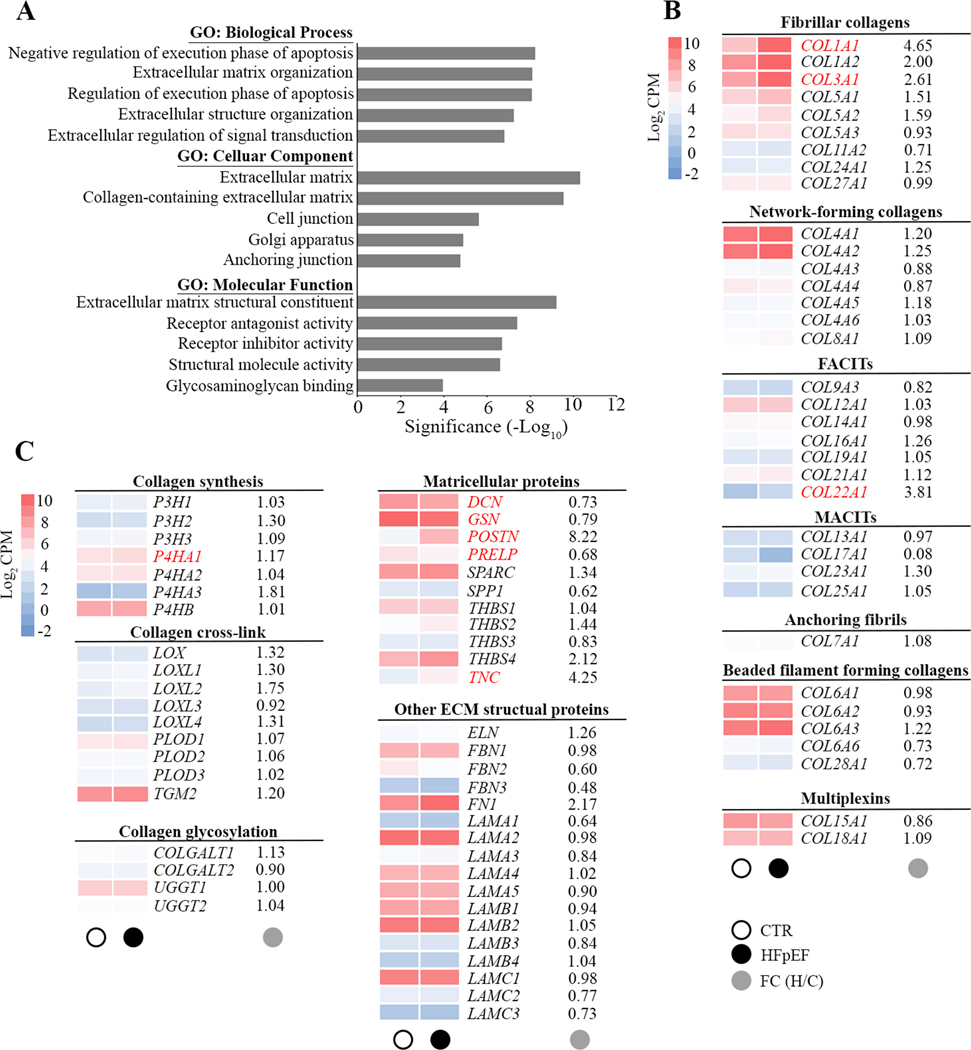
Figure 2. Gene Ontology enrichment analysis of differentially expressed genes.
A, Bar chart showing the top 5 gene ontology (GO) terms for biological process, cellular component and molecular function ranked by fold enrichment following analysis of all differentially expressed HFpEF genes. Significant enriched GO terms are provided. B and C, Heat maps depict the average expression levels (average log2 CPM) of individual genes in the extracellular matrix in CTR (○) and HFpEF(●). Main targets in subfamilies of fibrillar collagen, nonfibrillar collagen, collagen synthesis and modification, matricellular proteins and other extracellular matrix (ECM) structural proteins are shown as average gene expression levels of CTR (n=14) and HFpEF (n=16) hearts. The fold changes (●) in gene expression in HFpEF is provided and significant changes in gene expression are highlighted in red. FACITs, fibril-associated collagens with interrupted triple helices; MACITs, membrane-associated collagens with interrupted triple helices.

