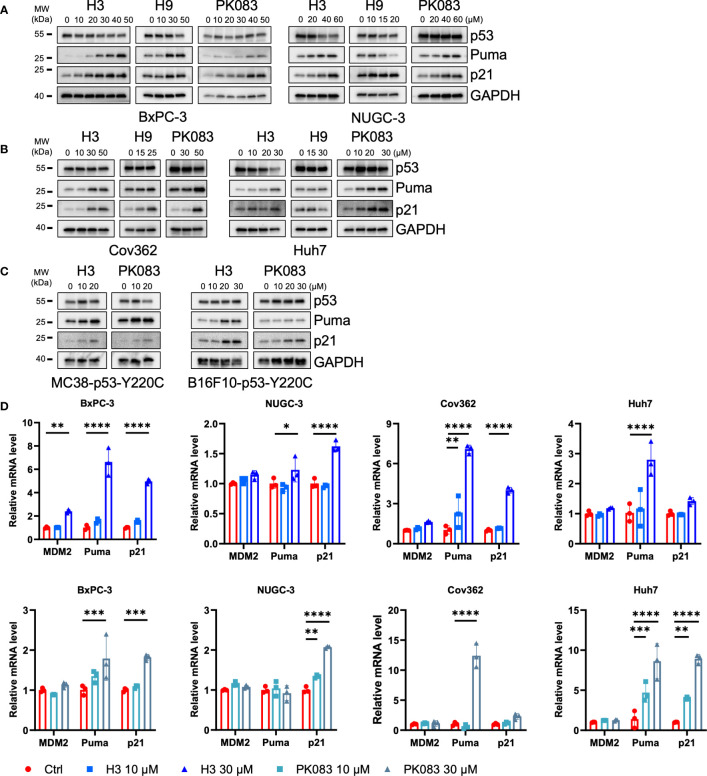
Figure 3.
H3 activates p53 target gene expression. (A–C) Immunoblotting to determine the protein levels of the indicated p53 targets after H3, H9, and PK083 treatment for 24 h. (D) Quantitative polymerase chain reaction (qPCR) determination of the mRNA levels of the indicated p53 targets after H3 and PK083 treatment for 24 h. Quantitative reverse transcription (qRT)-PCR analyses results were normalized using glyceraldehyde 3-phosphate dehydrogenase (GAPDH) as an internal control gene. The fold-change in each gene was calculated using the 2−ΔΔ CT method. Error Bars in (D) represent the mean ± SD. p values were calculated using two-way ANOVA analysis followed by Dunnett’s multiple-comparison test. *p<0.05, **p<0.01, ***p<0.001, and ****p<0.0001.

