Figure 5.
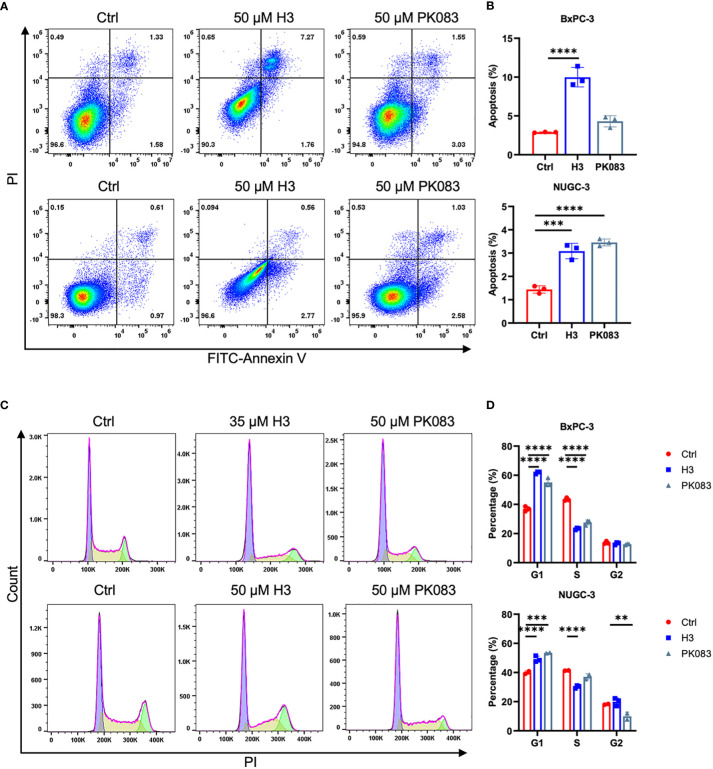
H3 induces cycle arrest and apoptosis in p53-Y220C mutant cells (A) Flow cytometric plots of annexin V vs. propidium iodide (PI) staining in BxPC-3 cells after treatment with 50 μM H3 or 50 μM PK083 for 42 h, and NUGC-3 cells after treatment with 50 μM H3 or 50 μM PK083 for 24 h. (B) From the histograms, the proportion of cell apoptosis were statistically analyzed. p values were calculated by one-way ANOVA followed by Dunnett’s multiple-comparison test. (C) Cell cycle analysis via PI staining followed by flow cytometry. BxPC-3 cells after treatment with 35 μM H3 or 50 μM PK083 for 24 h, and NUGC-3 cells after treatment with 50 μM H3 or 50 μM PK083 for 24 h. (D) From the histograms, the proportion of cell cycle distribution were statistically analyzed. p values were calculated by two-way ANOVA followed by Dunnett’s multiple-comparison test. Error Bars in (B, D) represent mean ± SD. **p < 0.01, ***p < 0.001, and ****p < 0.0001.

