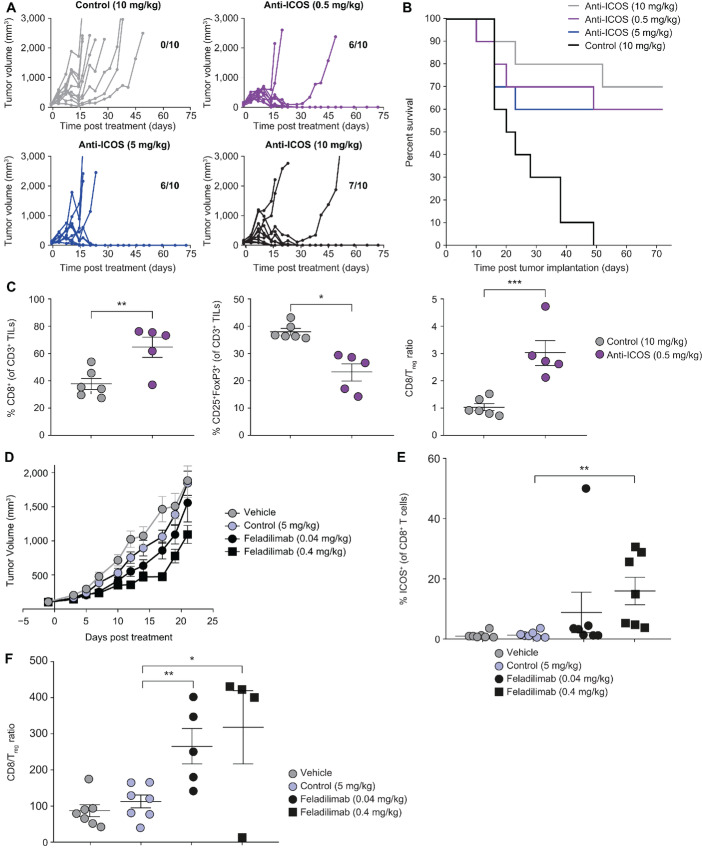
FIGURE 3.
ICOS agonist mAbs demonstrate single-agent antitumor activity. A–C, EMT6 (subcutaneous) tumor-bearing BALB/c mice were administered intraperitoneally biweekly with anti-mouse ICOS mAb [7E.17G9 (mIgG1)] or isotype control (mIgG1) for a total of six doses and evaluated for tumor growth (A), survival (B), and pharmacodynamic changes (C) within tumors. Each line in A represents an individual mouse (n = 10/group). Number of tumor-free mice at study termination are indicated within each subpanel. B, Kaplan–Meier plot illustrating OS in A. C, Percentage of tumor-infiltrating CD8+ T cells, Treg cells, and associated CD8:Treg cell ratio 48 hours after the third dose of anti-ICOS mAb (10 μg, ∼study day 7) assessed using flow cytometry (nonspecific binding was blocked with human or mouse Fc block). Each symbol represents an individual mouse. D–F, A549 (subcutaneous) tumor-bearing NSG mice were administered intraperitoneally biweekly with feladilimab or isotype control for a total of six doses. D, A549 tumor growth kinetics for controls (PBS or isotype) and feladilimab-treated groups (0.04 mg/kg, black; 0.4 mg/kg, red). Percentage of tumor-infiltrating ICOS+ CD8+ T cells (E; assessed using flow cytometry with nonspecific binding blocked using human or mouse Fc block) and associated CD8:Treg cell ratio (F) 48 hours after the fourth dose of feladilimab (∼study day 21). Data in C, D, E, and F represent the mean ± s.e.m. Significance was determined by unpaired Student t test. See Supplementary Fig. S1 for flow cytometry gating strategy for C, E, and F. CD8/Treg ratios were calculated on the basis of percent (%) positive CD8s (of live CD45+) and FoxP3/CD25+ Treg cells (of live CD45+ CD4+ cells). ICOS, inducible T-cell costimulator; i.p., intraperitoneal injection; mAb, monoclonal antibody; OS, overall survival; s.e.m., standard error of the mean.

