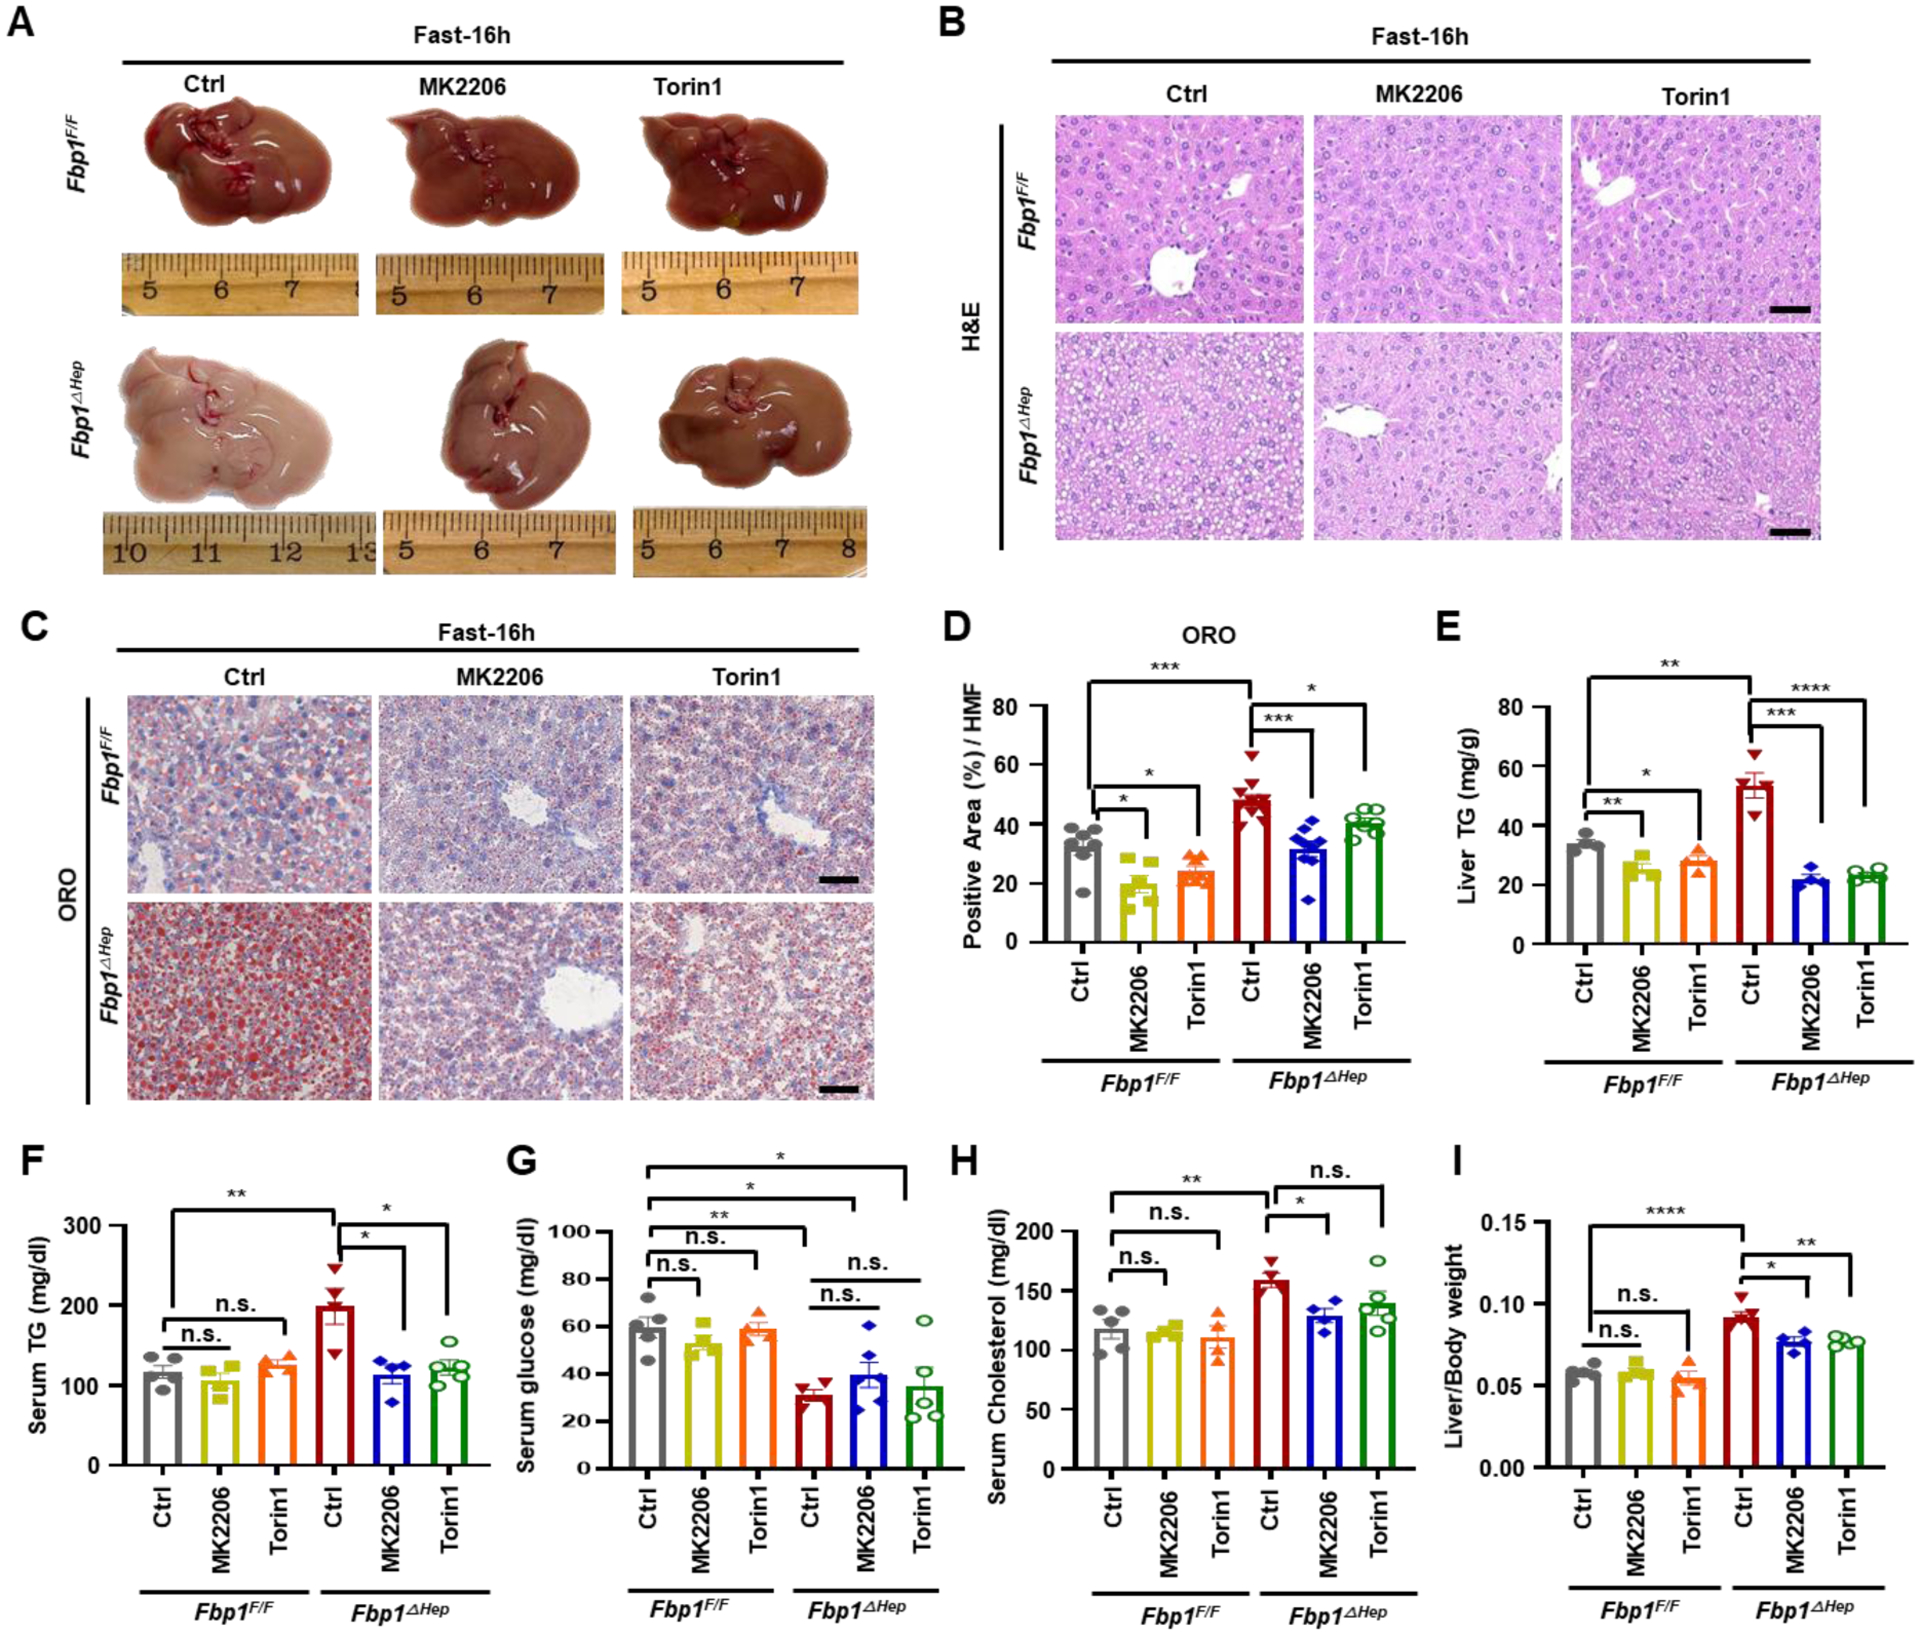
Figure 3. AKT inhibition attenuate hepatomegaly, hepatosteatosis and hyperlipidemia but not hypoglycemia.

(A) Gross liver morphology of 8-wo Fbp1F/F and Fbp1ΔHep mice treated −/+ MK2206 (100 mg/kg) or Torin1 (10 mg/kg), followed by 16 h fast before sacrifice.
(B-D) H&E (B) and ORO staining (C) of liver sections from 3A (n=4–5). Scale bars, 20 μm. ORO staining intensity per HMF was determined by Image J (D).
(E-I) Liver TG (E), serum TG (F), serum glucose (G), serum cholesterol (H) and liver/body weight ratio (I) in indicated mice (n=4–5).
Data are presented as mean ± SEM. n.s., not significant, P≥0.05. *P < 0.05, **P < 0.01, ***P < 0.001, ****p < 0.0001 (Unpaired two-tailed t test).
