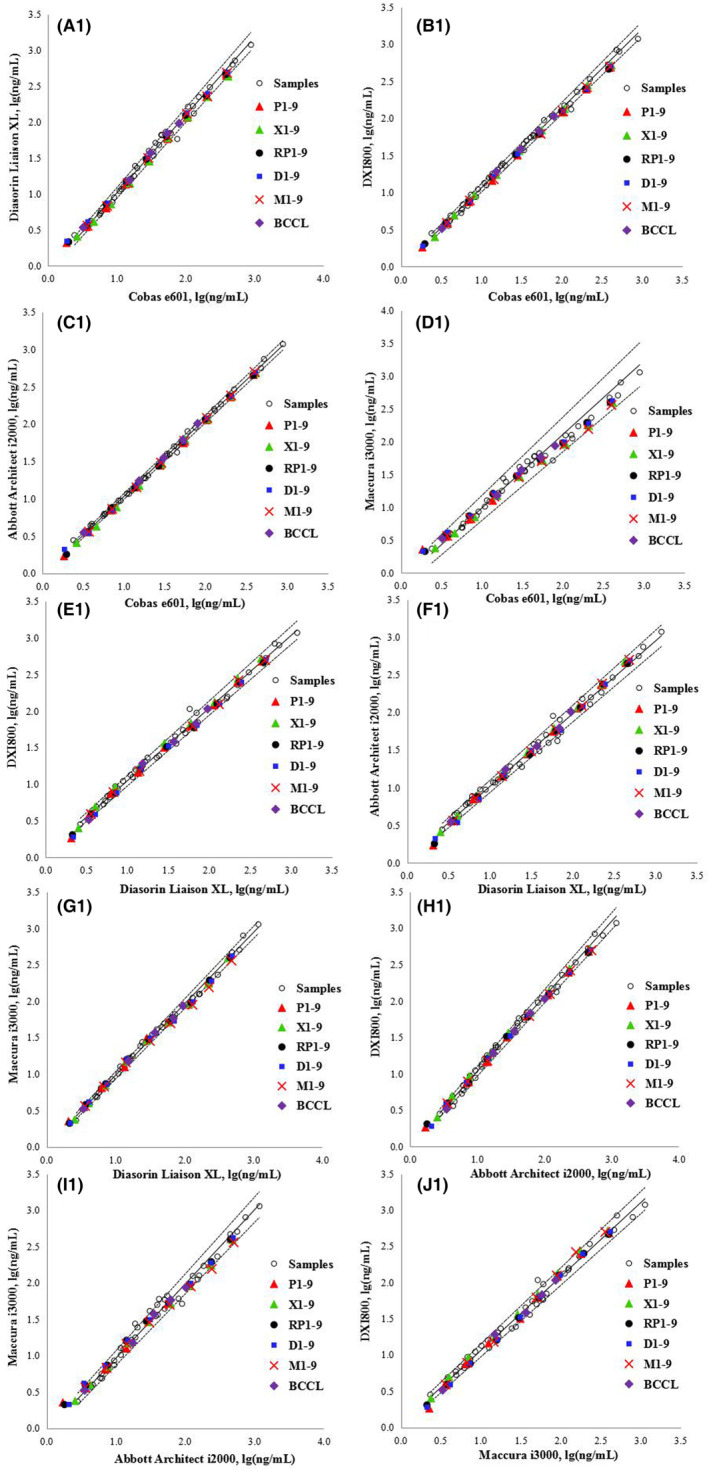
FIGURE 3.

Commutability assessment of RMs among the five analytical systems after correcting for biases according to the CLSI method. The solid black lines are regression curves, and the dashed lines are the two‐tailed 95% prediction lines. P1–9, XQ1–9, D–9, M1–9, and RP1–9 represent the nine levels of WHO 73/601 diluted in PBS (P), a healthy human serum pool (XQ), DMEM (D), MEM (M), and RPMI 1640 (RP), respectively. BCCL represents the five levels of candidate RMs.
