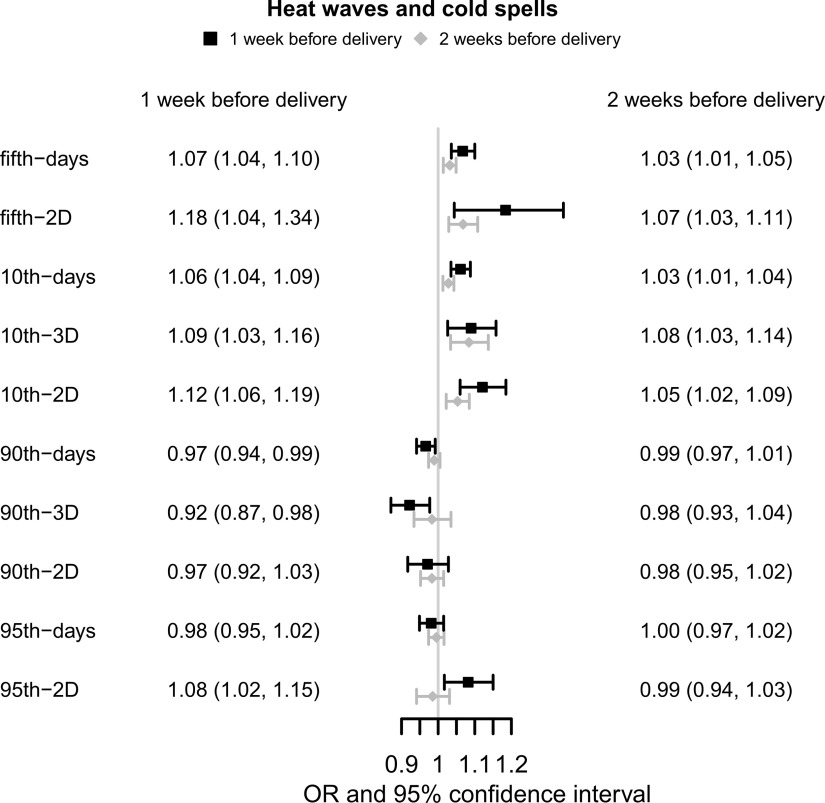
Figure 1.
Associations of extreme climate events with the preterm birth in China Labor and Delivery Survey (). Note: Generalized linear mixed model was used to examine the associations. ORs represent a 1-unit increase in extreme weather events and are presented with a 95% CI. All models were adjusted for maternal age, maternal ethnicity, maternal education, insurance type, child sex, parity, GDP per capita, geographic region, conception season, conception year, , and . CI, confidence interval; GDP, gross domestic product; OR, odds ratio; , particulate matter with aerodynamic diameter .

